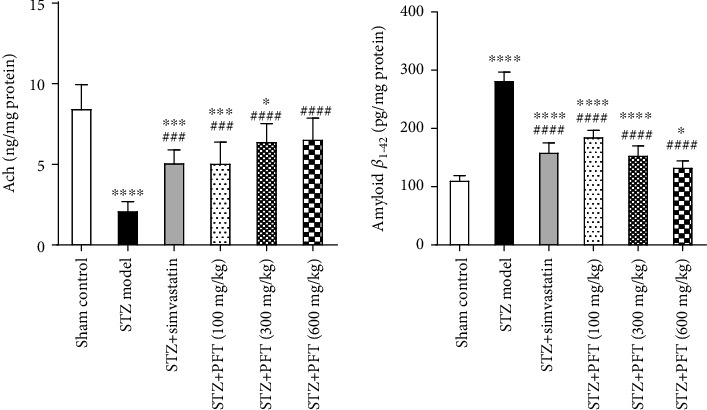
Figure 3.

PFT reversed STZ-induced alterations in Ach and amyloid β1-42 levels in the hippocampus. Each bar with vertical line represents the mean ± SD of 6 mice per group; ∗significantly different from the sham control group at p < 0.05, ∗∗∗significantly different from the sham control group at p < 0.001, ∗∗∗∗significantly different from the sham control group at p < 0.0001, ###significantly different from STZ group at p < 0.001, ####significantly different from STZ group at p < 0.0001 using one-way ANOVA followed by Tukey's multiple comparisons test.
