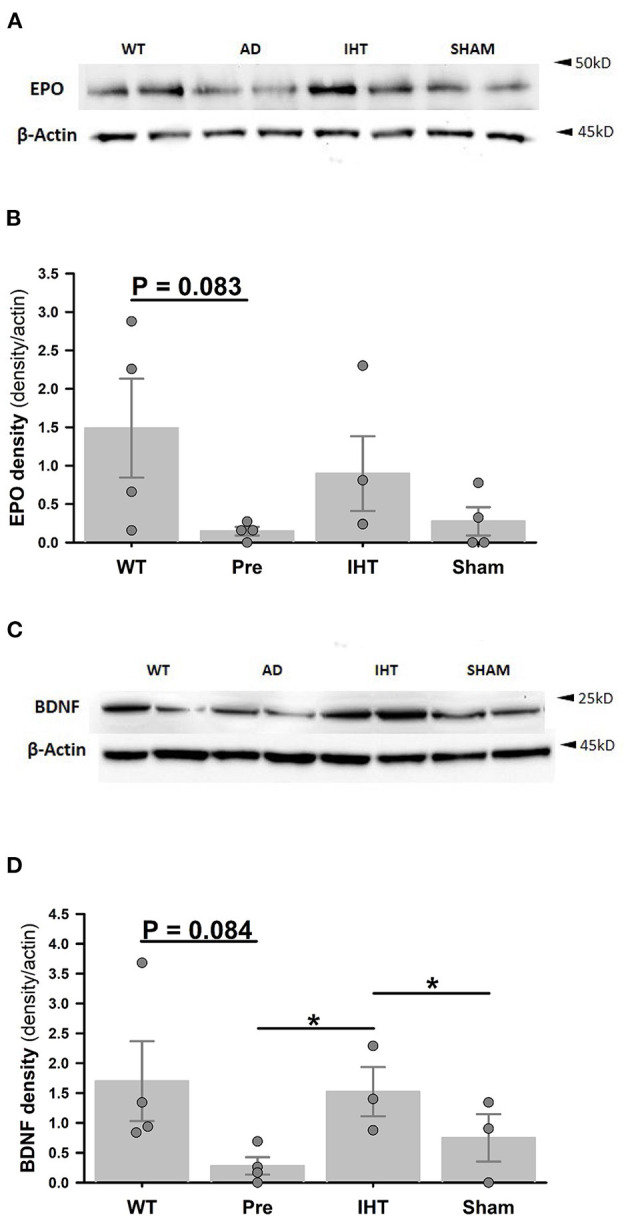
Figure 4.

Cerebrocortical erythropoietin and BDNF immunoblots. (A) Cerebrocortical erythropoietin (EPO) and β-actin immunoblots. (B) EPO band densities normalized to β-actin band densities. (C) Cerebrocortical BDNF and β-actin immunoblots. (D) BDNF densities normalized to β-actin band densities. Analyses of the band densities indicated that cerebrocortical EPO and BDNF contents were lower in the 3xTg-AD vs. WT mice. IHT, but not sham-IHT, tended to restore EPO and BDNF contents in the 3xTg-AD mice. For EPO and BDNF contents, treatment factors are P = 0.257 and P = 0.003, respectively, and time factors are P = 0.217 and P = 0.004, respectively. *P < 0.05 for comparisons indicated by horizontal lines. Individual data points and group mean ± standard error of the mean are shown.
