
Extended Data Fig. 2. Number of ITP events per day since September 2019.
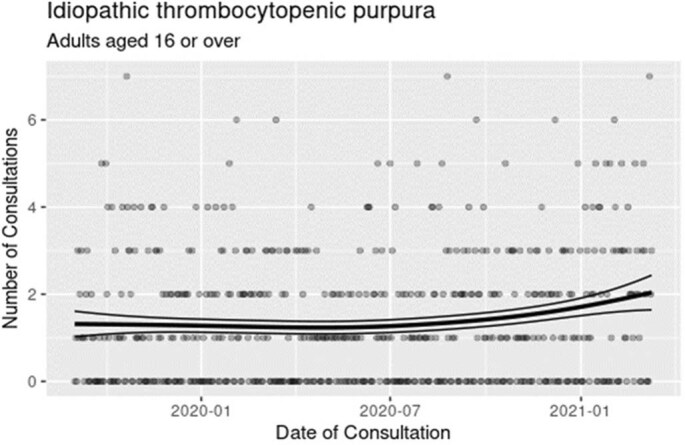
Note: The line comes from a generalised additive Poisson model fitted to the number of cases with a simple spline term for the trend. Graph based upon data up to 22 March 2020. One of the assumptions of the standard self-controlled case series analysis is that the underlying rates of the event are constant over time. Fig. S2 shows the number of events for idiopathic thrombocytopenic purpura (ITP) since September 2019. A generalised Additive Poisson model was fitted to the daily data with a spline for the number of days since 1 September 2019 and a factor for the months. There was no evidence of any seasonal pattern associated with the months of the year (p = 0.189, using a change in deviance test) but there was evidence of a non-linear trend (p = 0.0138). Further investigation of the trend was undertaken by including binary change in level variables associated with the period post BNT162b2 (8 December 2020) and post ChAdOx1 (5 January 2021) This showed that there was no residual increasing trend (p = 0.58), nor any change in level following the introduction of BNT162b2 (p = 0.4315) but there was evidence of a change in level amounting to an 0.44 (95% CI 0.20, 0.68; p = 0.0003), additional events per day in the period after the introduction of the ChAdOx1 vaccine.