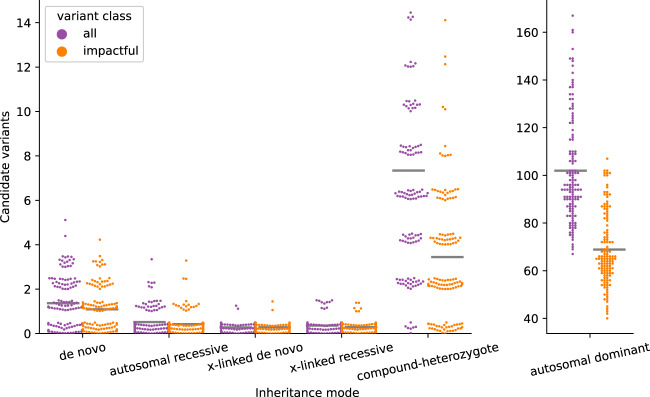
Fig. 3. The number of candidate variants that follow different inheritance modes per exome.
The number of candidate variants for 149 exome trios are separated by inheritance mode and colored by variant class. Variants deemed impactful by slivar using annotations from VEP, snpEff, and bcftools. Counts for autosomal dominant variants are shown in a separate plot due to the much larger numbers. Each point represents the number of candidate variants for a single family (y-axis) passing the inheritance mode (x-axis), genotype-quality, population allele-frequency, and allele-balance filters. Gray bars indicate the mean number for each class and inheritance mode. Points are jittered slightly to allow viewing more samples simultaneously.

