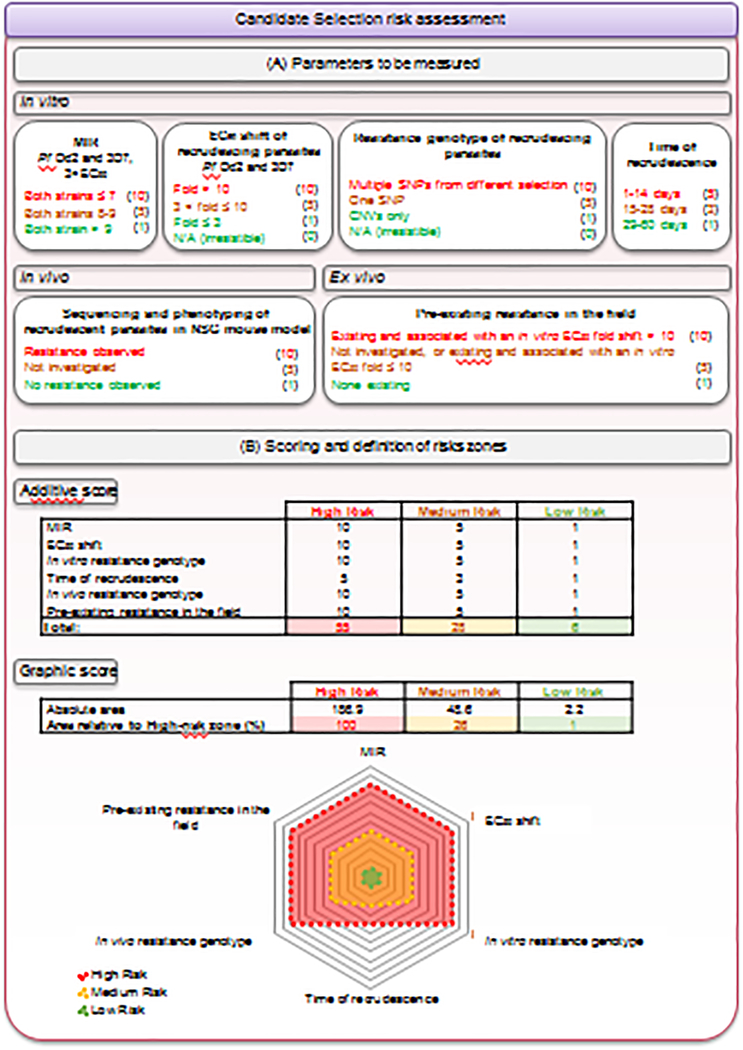
Figure 4. Quantitative assessment of the risk of resistance.
(A) The risk of resistance is assessed for each compound by integrating various in vitro (log10MIR, EC50 fold shift, resistance genotype and time of recrudescence in resistance selection experiments on at least two P. falciparum strains), in vivo (resistance-conferring mutation(s) in resistant recrudescing parasites from humanized mice efficacy studies) and ex-vivo (pre-existing resistance in the field) parameters. Each parameter is assigned a score corresponding to a high (red), medium (yellow) or low (green) risk, as depicted in parentheses. The weighting of the parameters varies according to their relevance. For instance, the day of recrudescence during in vitro selections was attributed a lower weight, to acknowledge the fact that whether this event occurs or not is more important than the timing. In contrast with the in vitro resistance genotype, where a clear distinction between SNPs and CNVs is made, both alterations are considered equally important in the in vivo studies. Indeed, while CNVs are more frequent in vitro, usually leading to small EC50 shifts (i.e., < 5-fold), they can remain clinically relevant as evidenced with pfmdr1 copy number and mefloquine. Some data, particularly from in vivo studies, and the pre-existence of resistance conferring-mutations in the field, are not always available. To acknowledge the risk of such a knowledge gap and encourage teams to obtain these data, a medium score of 5 is attributed to the “not investigated” category. Publicly available information on genome sequence diversity is constantly increasing. While a thorough investigation at a given time point may reveal no concerns, updated information should be regularly considered for a given compound even after candidate declaration and during clinical development. Of note, some criteria, such as the EC50 fold shift, the time of recrudescence, or the Log10MIR value, may spread over two categories. In this case, we select the median score between the two categories. (B) Two complementary approaches are then used to classify compounds into a global risk zone: a numerical approach based on an additive score and a graphic assessment based on the relative area of a spider chart overlapping with the total high-risk area. A compound with a cumulative score (method A) up to 6 is classified in the low-risk zone, between 7 and 28 is in the medium-risk zone, and 29 or above is in the high-risk zone. A compound with an area (method B) covering up to 1% of the high-risk area is classified in the low-risk zone, between 1 and 26% is in the medium-risk zone, and above 26% is in the high-risk zone. As shown in Supplementary Figure 1, both approaches lead to the same outcome.

