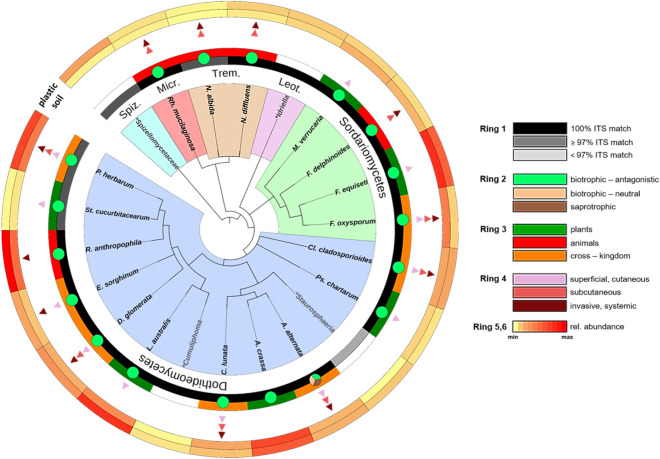
Figure 4.
Phylogenetic distributions within the PCM. Displayed are those 22 OTUs accounting for ≥ 0.5% of plastisphere reads and contributing ≥ 0.3% to the plastic/soil dissimilarity based on SIMPER analysis with occurrence on MP in every site. OTUs classified at the species level (black font) were annotated with trait data. OTUs classified to at genus or higher level were not annotated (grey font). (*) indicates ‘unclassified’. Branch colours code for the indicated fungal classes, where Spiz. = Spizellomycetes, Micr. = Microbotryomycetes, Trem. = Tremellomycetes, Leot. = Leotiomycetes. Ring 1 indicates the success of OTU assignment based on the presence of a representative type strain or isolate ITS sequence match in the UNITE database. Ring 2 shows the most likely trophic mode for each taxon. Ring 3 displays the host (kingdom) range of the fungal taxa. The presence of at least one triangle in Ring 4 indicates potential human pathogenicity of the respective fungus, while the number and colour of the triangles code for possible virulence based on the known infection sites of the human body. Ring 5 and 6 indicate the relative abundance of each taxon on soil and plastic, respectively.

