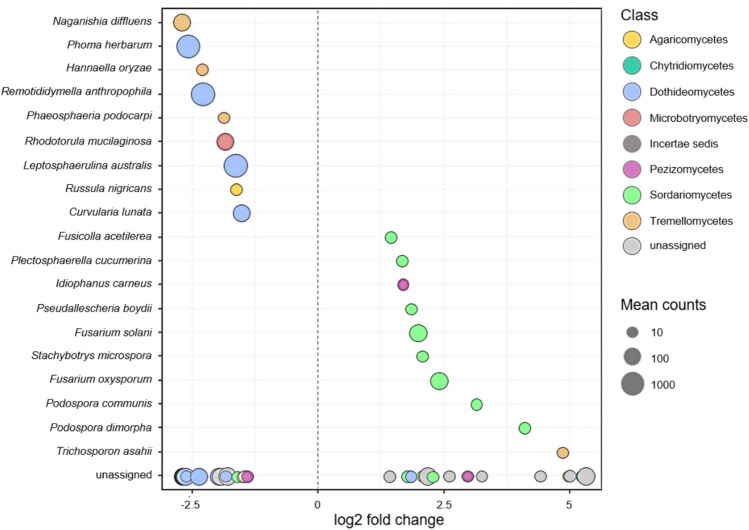
Figure 5.
Differentially abundant fungal species of the soil and plastisphere mycobiome identified by DESeq2 analysis. Negative values indicate a significantly (p < 0.05) higher abundance of species on MP. Species are plotted according to their log2 fold change differential abundance and color-coded according to classes. Size factor normalisation was implemented in DESeq2. Bubble size corresponds to the mean read counts across all samples.

