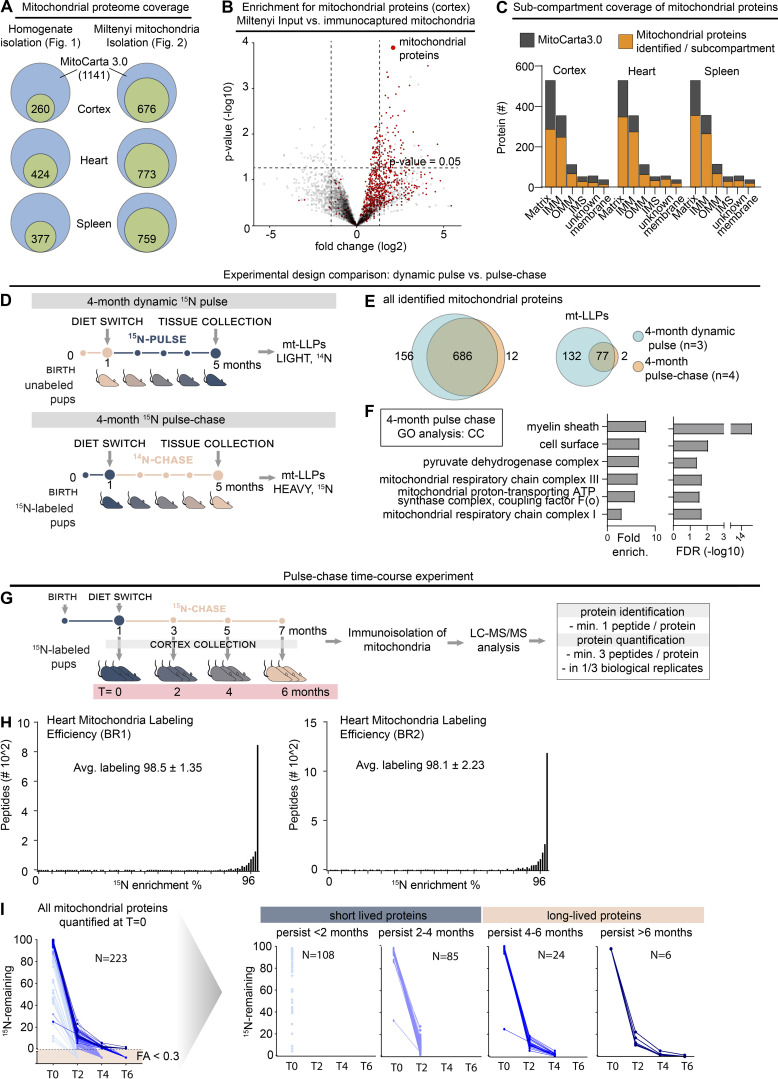
Figure S2.
LLPs are preferentially associated with the IMM. Related to Fig. 2. (A) Coverage of mitochondrial proteome across immuno-isolated mitochondria. Cumulative number of proteins identified shown. n = 2–4 mice. (B) Immuno-isolated mitochondria are substantially enriched in mitochondrial proteins. n = 4 mice. (C) Submitochondrial distribution of identified mitochondrial proteins from cortical, heart, and spleen tissue extracts. Identified proteins are shown in orange; MitoCarta3.0 proteins are shown in gray. n = 3 mice. (D) Schematic illustrating two-generation whole-animal metabolic 15N-dynamic pulse compared with 14N pulse-chase experiment design. (E) Venn diagram comparing proteins identified in the 15N-dynamic pulse and 14N pulse-chase experiments. enrich., enrichment. (F) GO analysis of the mt-LLPs identified after 4 mo of 14N pulse-chase showing an enrichment for terms related to mitochondria. See also Table S1. (G) Time course pulse-chase experiment of 15N-labeled mice (born to 15N-labeled females) that were chased with 14N diet for 0, 2, 4, and 6 mo. Note that the 4-mo 14N pulse chase time point shown here represents the same dataset as in panels D and E. (H) Metabolic labeling efficiency of second-generation pups analyzed at t = 0 (at weaning) in the 14N pulse-chase experiments. Average peptide labeling percentage is indicated ± SD. (I) Summary of protein degradation trends across chase periods. Only proteins identified at t = 0 which were then tracked through the time course are shown. n = 3–4 mice.

