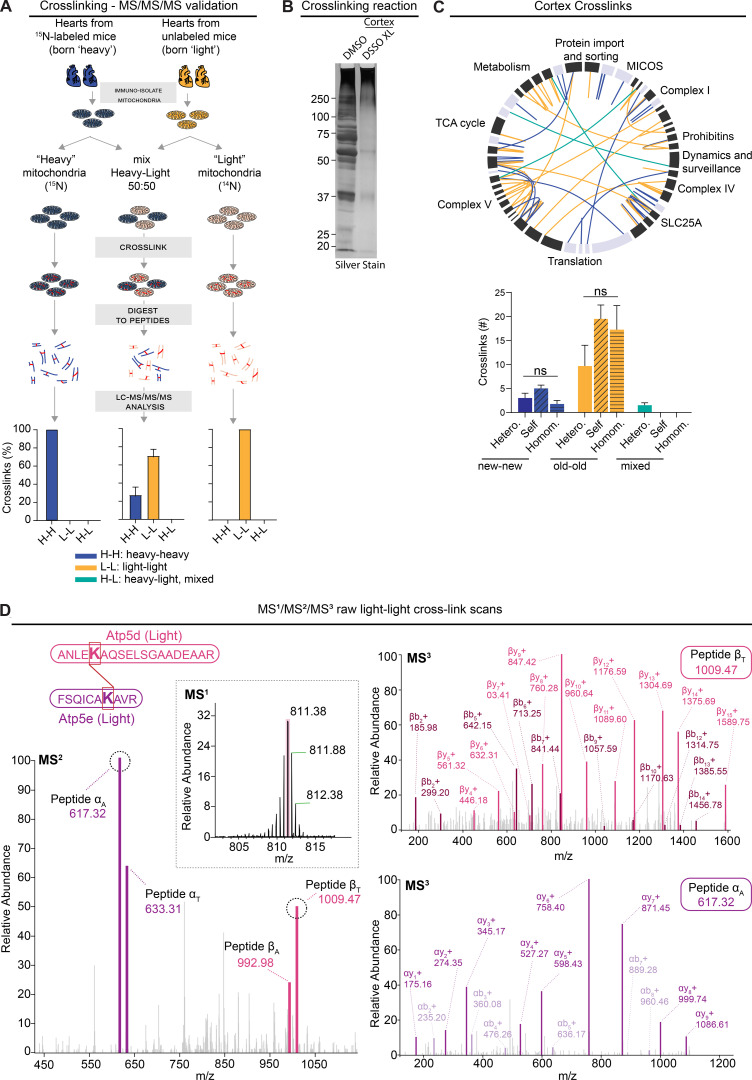
Figure S5.
Limited mixing and exchange of mt-LLPs. Related to Figs. 4 and 5. (A) Schematic illustrating control experiments used to assess the rigor of our new method of cross-link analysis of 15N dynamic-labeling experiments. Plot indicates percentage of heavy-heavy, light-light, or heavy-light. (B) Silver-stained gel of cross-linked cortical and heart mitochondrial isolations showing a shift toward higher molecular weights after cross-linking with 1 mM DSSO. (C) XiView map of cortical cross-links. Bar graph indicates identified cross-linked peptides broken down by class and nitrogen isotype. Hetero., interlink; self, self-link (nonoverlapping peptide); homom., self-link (overlapping peptides). (D) Representative example of high-resolution MS2 and MS3 spectra used to identify 14N-14N cross-linked ≥4-mo-old Atp5d and Atp5e peptides. Mean ± SEM; A, n = 2 mice; C, n = 4 mice; data not significant (n.s.) by Kruskal–Wallis ANOVA with Tukey’s multiple comparisons test.

