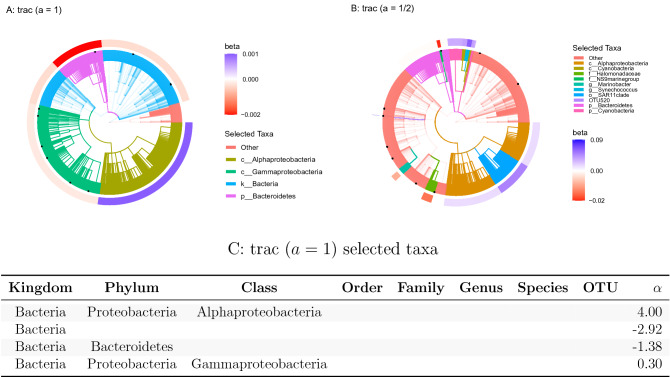
Figure 5.
Taxonomic tree visualization of trac aggregations (OTUs as taxon base level, for salinity prediction using Tara data (training/test split 1). Each tree represents the taxonomy of the miTAG OTUs. Colored branches highlight the estimated trac taxon aggregations. The black dots mark the selected taxa of the sparse log-contrast model. The outer rim represents the value of coefficients in the trac model from Eq. (1). (A) Standard trac () selects four aggregations on the kingdom, phylum, and class level. (B) Weighted trac () selects ten aggregations across all taxonomic ranks, including a single OTU (OTU520). This OTU is also selected by the sparse log-contrast model which comprises nine OTUs in total (black dots) (see Suppl. Table 18 for the selected coefficients). Both trac models select the phylum Bacteroidetes and the Alphaproteobacteria class. (C) The table lists the coefficients associated with Eq. (2) for the trac () model corresponding to the tree shown in ( A). These values are in the same units as the salinity response variable.

