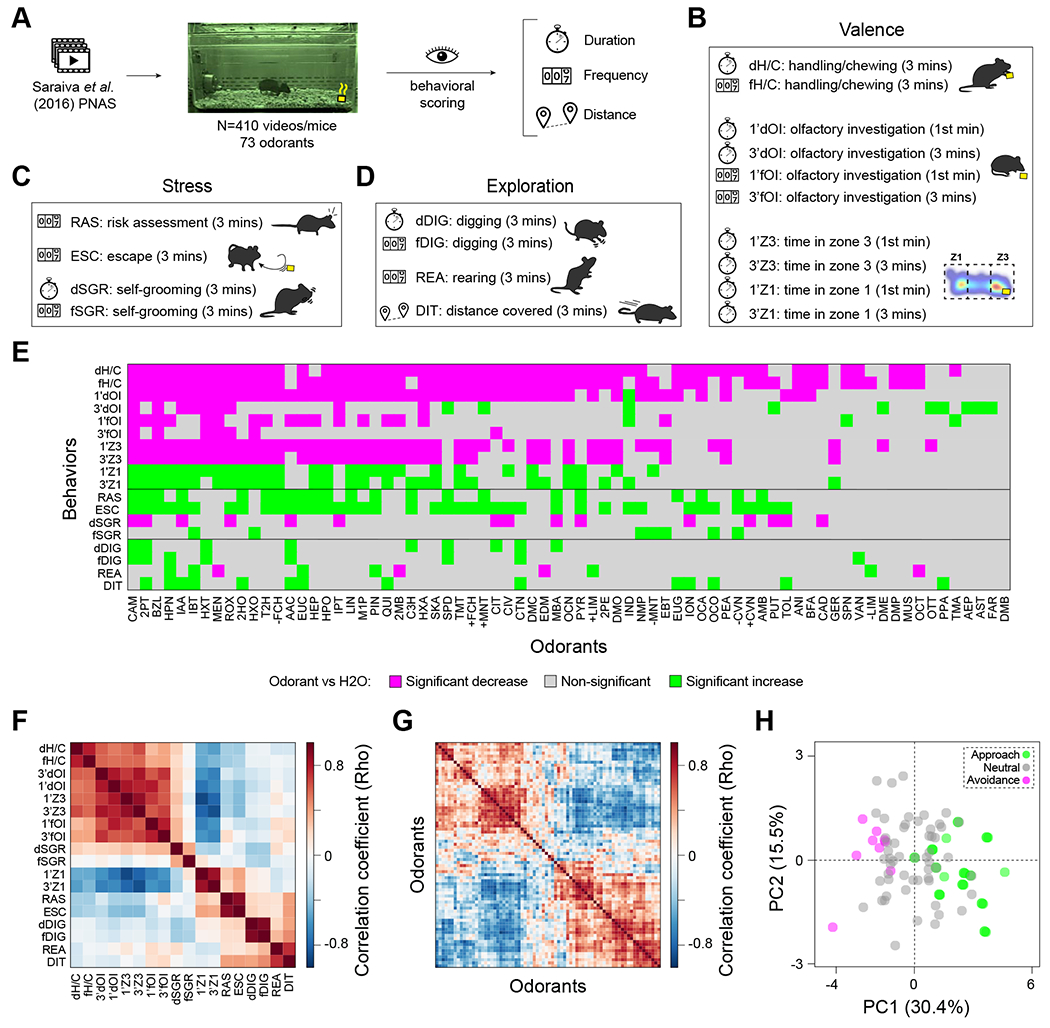
Figure 1. An olfactory-ethological atlas and the primary axis of olfactory perception in mouse.

(A) Videos were scored for 18 behavioral parameters, grouped in three broad categories: (B) valence, (C) stress, (D) exploration. (E) A graphical display summarizing the combinatorial behavioral patterns for the 73 odorants tested. Behaviors showing significant (one-way ANOVA, BKY multiple comparisons correction, n = 5-10 per odorant) increases, decreases and non-significant responses compared to H2O are indicated in green, magenta, and grey squares, respectively. (F) Correlation across odorants between each of the 18 behaviors (n = 3-7 per odorant). (G) Correlation across behaviors between each of the 73 odorants and H2O (n = 3-7 per odorant). In both F and G, odorants and behaviors are ordered to illustrate clustering. Two major clusters of odorants stand out. (H) Principal Component Analysis of the 18 behaviors for H2O and the 73 tested odorants (n = 3-7 per odorant). Circles are colored to indicate avoidance (magenta), neutral (grey), or approach (green) odorants. See also Figure S1, and Data S1.
