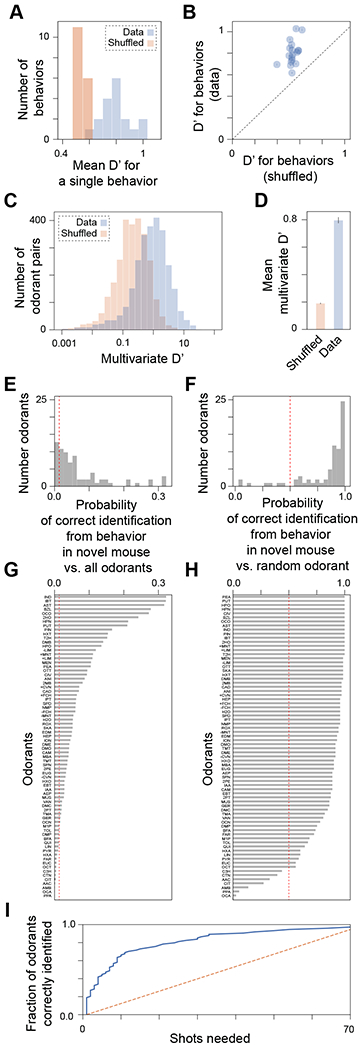
Figure 2. Discriminability of odorants using behaviors and out-of-sample prediction of odor identity.

(A) D’, a measure of discriminability between two odorants, is greater for the data than for a shuffling (across mice) of the data. (B) Same data as in A, except shown for each behavior (circle) vs. its corresponding shuffle. Error bars (inside circles) represent SEM taken over all odorant pairs. (C) Using all behaviors simultaneously, the multivariate measure D’ is computed. (D) Multivariate D’ is ~4x larger for the real data than for shuffled data. (E-H) A linear discriminant analysis classifier was trained on all odorants, using all but one mouse for each odorant. Predictive performance was evaluated for the remaining mice (one odorant each). (E) A histogram of the probability that the correct odorant (out of 74 possibilities) is identified from a new mouse’s behavior. The dashed red line reflects chance performance. (F) Mean performance for each odorant; higher values mean the odorant is easier to uniquely identify from behavior. (G) Similar to E, but for classification of the true odorant against a random alternative odorant. Chance is now 50%, as reflected by the dashed red line. (H) Mean performance for each odorant in G. 1.0 means that behavior was always sufficient to identify the odorant vs. any specific alternative odorant. (I) Number of shots (guesses) that the classifier needs to determine the correct odorant (out of 74 possibilities) from novel mouse behavior. This value (solid blue line) is shown for all 74 odorants, ranked from fewest to greatest number of shots required. The orange dashed line represents chance performance. See also Figures S2, and S3.
