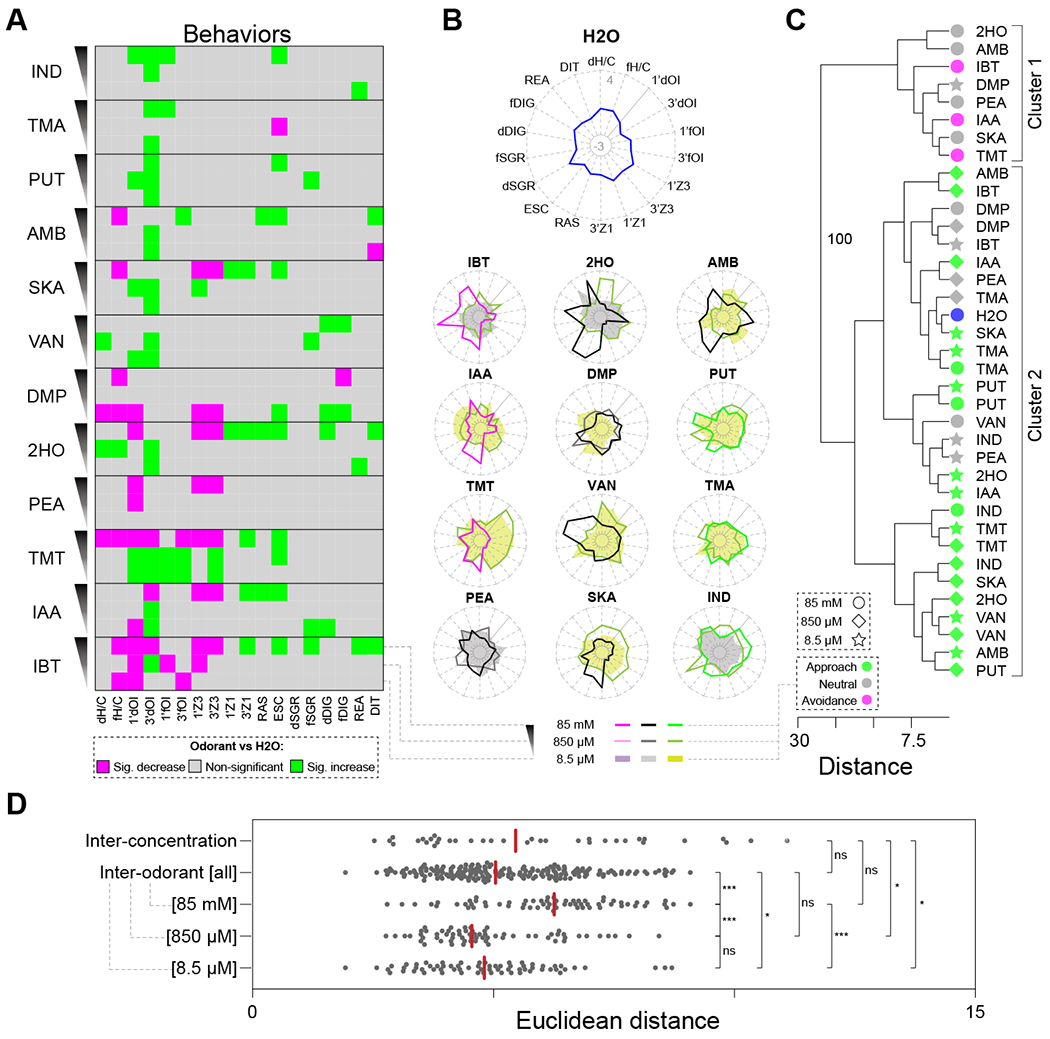
Figure 5. The effect of odorant concentration on behavior.

(A) A graphical display summarizing the behavioral codes for the 12 odorants tested at three different concentrations. Behaviors showing significant (one-way ANOVA, BKY multiple comparisons correction, n = 5-9 mice per odorant) increases, decreases, and non-significant responses compared to H2O are indicated in green, magenta, and grey squares, respectively. (B) The behavioral profiles (radar plots, z-scores) for H2O (top center) and the 12 odorants tested at three concentrations (85 mM, 850 μM and 8.5 μM) are shown. The behavioral profiles for the odorants classified at 85 mM as aversive, neutral, and approached are shown in different shades of magenta, grey/black, and green, respectively. The corresponding descending concentrations are depicted in lighter hues of the same color, irrespective of their valence at 850 μM and 8.5 μM. (C) Hierarchical clustering analysis of the behavioral profiles for the 12 odorants tested at the three different concentrations supported the existence of 2 clusters. Bootstrap values56 are shown only for strongly supported nodes, i.e., nodes displaying bootstrap values >70 (total 100 replications). (D) Plot comparing the Euclidean distances calculated for all pairwise inter-concentration comparisons (restricted to different concentrations within each odorant), inter-odorant comparisons (restricted to different odorants at the same concentration), and subsets of inter-odorant comparisons for each concentration separately (85mM, 850μM, and 8.5μM). Asterisks indicate significant differences (one-way ANOVA, BKY multiple comparisons correction): ns, non-significant; *P < 0.05; ***P < 0.001. See also Figure S5, and Data S3.
