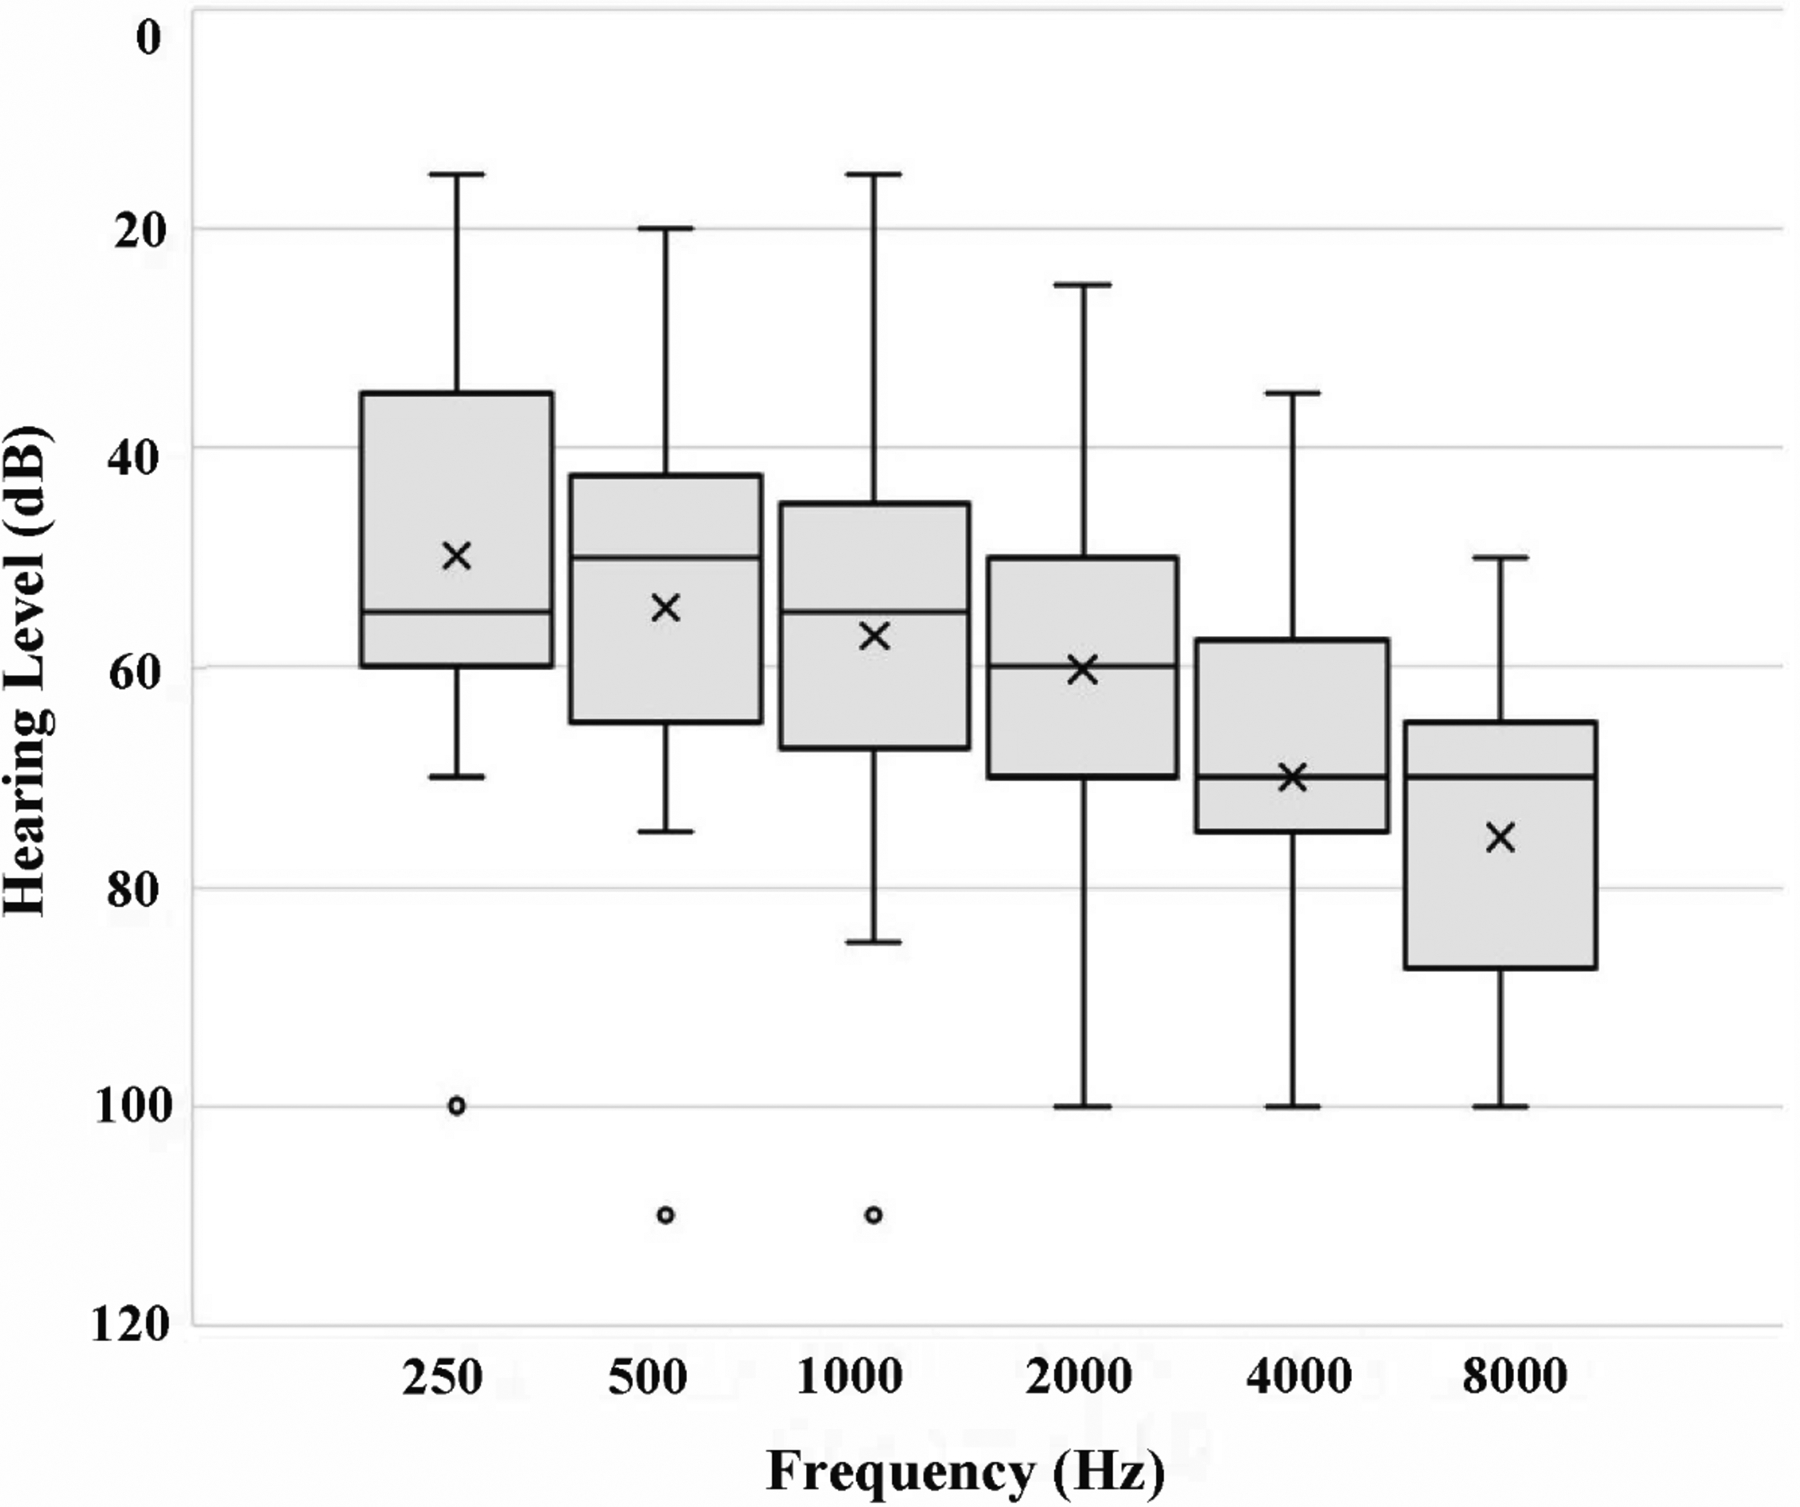
Figure 1.

Distribution of baseline audiograms in the cohort. Within each box, the horizontal line and × mark represent the median and mean, respectively. The box sizes correspond to the 25th–75th percentile (1st–3rd quartile), and the whiskers represent the full range, excluding the outliers. Represented by a circle, outliers were defined as data exceeding 1.5 times the interquartile range below the 1st quartile or above the 3rd quartile.
