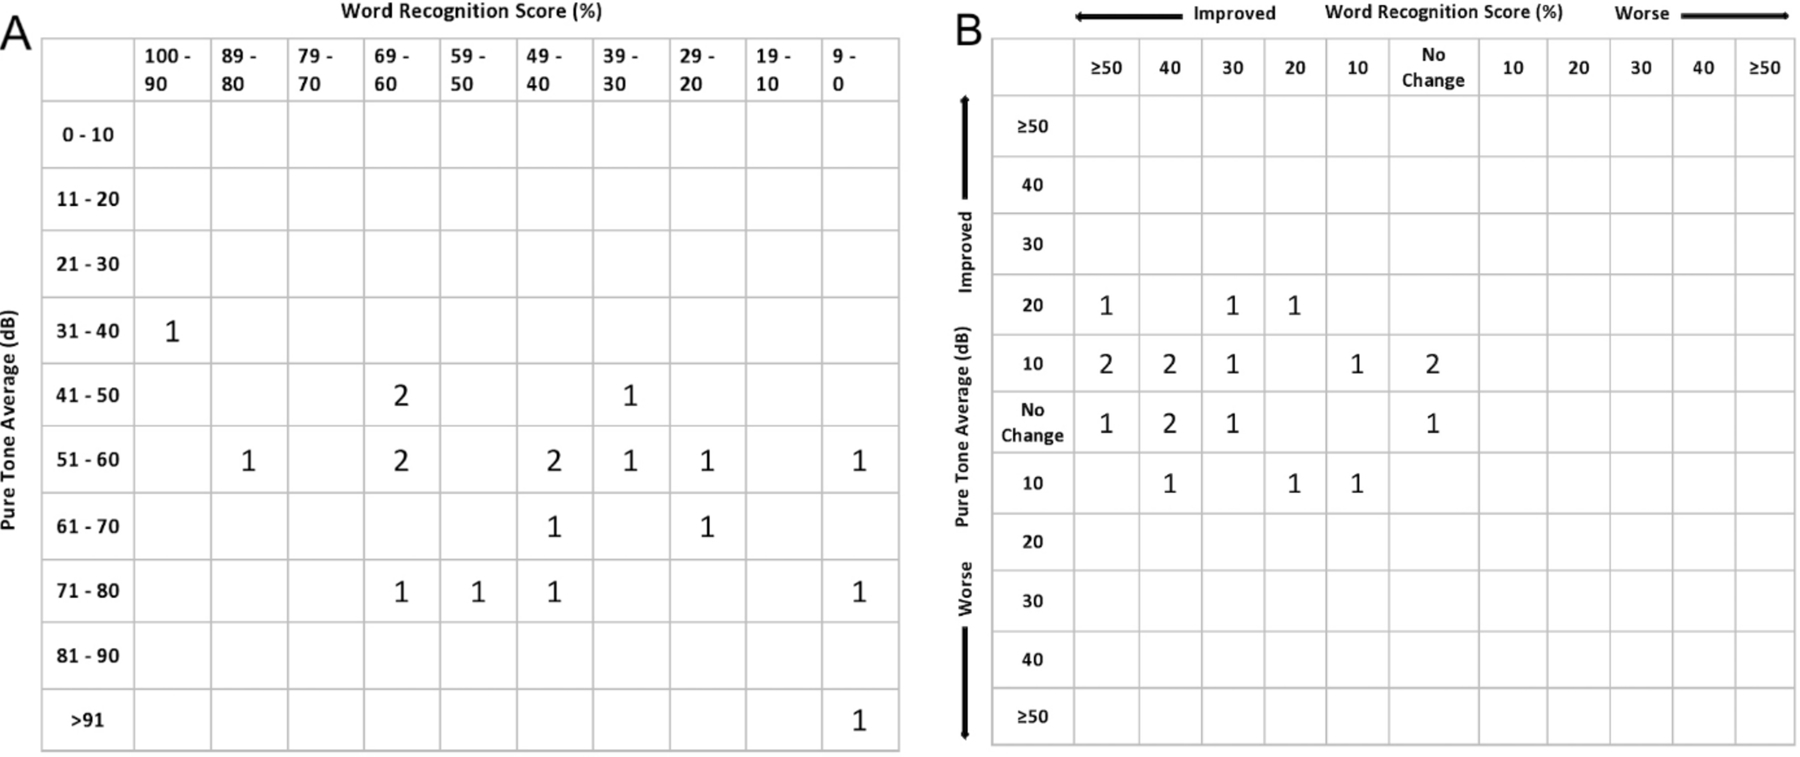
Figure 2.

Scattergram of (A) pre-treatment and (B) post-treatment hearing results in 19 patients. Pure tone averages (dB) are labeled on the Y-axis and word recognition scores (%) are labeled on the X-axis. Each number represents the number of patients with audiometric data that can be categorized in each square. The post-operative scattergram shows 11 out of 19 patients with minor PTA improvements of ≤20 dB, and 16 out of 19 patients with varied WRS score improvements.
