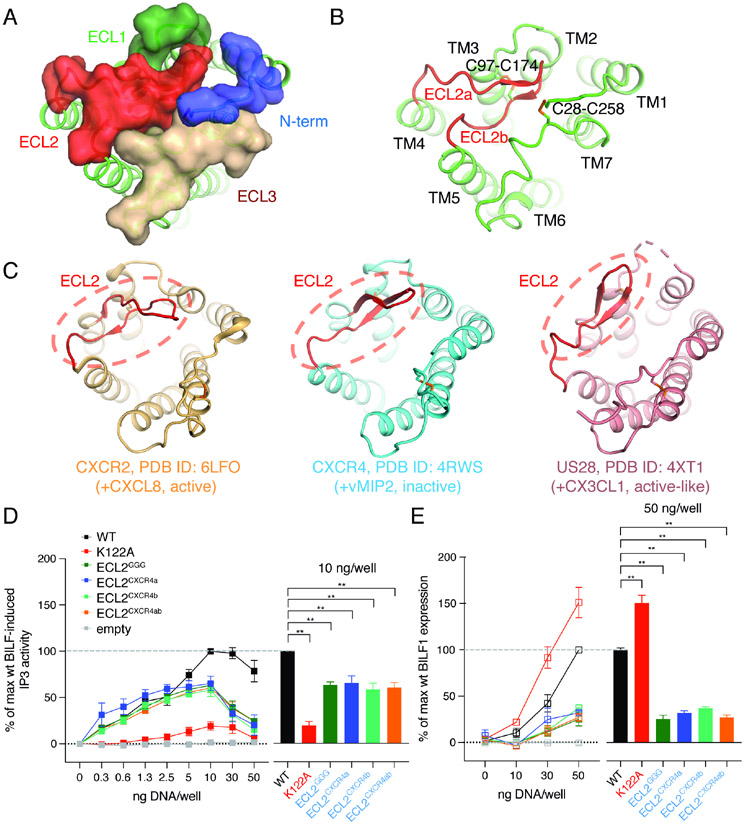
Figure 2. BILF1 shows the occluded extracellular ligand-binding pocket in comparison with chemokine receptors.
(A) A top view of the BILF1 structure. N-terminal loop (blue), ECL1 (pale green), ECL2 (red), and ECL3 (wheat) are shown as transparent surface presentation and overlaid on the cartoon model of BILF1 (green). (B) The extracellular cartoon view of BILF1 showing the ECL2 structure capping the extracellular pocket, with ECL2 highlighted with red color. ECL2a and ECL2b indicate the loops composed of amino acid residues between L167 and M173, and between R173 and K180, respectively. Disulfide bond-forming cysteines are displayed as sticks. (C) Extracellular structures of CXCR2 (light orange, PDB ID: 6LFO), CXCR4 (cyan, PDB ID: 4RWS), and US28 (pink, PDB ID: 4XT1). The ECL2s are highlighted with red color and dashed circles. Disulfide bondforming cysteines are displayed as sticks. The extracellular pocket of BILF1 is blocked by ECL2, whereas it is largely open in the cases of chemokine receptors (CXCR2, CXCR4, and US28). (D) Gi signaling of the wild-type and ECL2 modified BILF1. ECLGGG, ECLCXCR4a, and ECLCXCR4b donate the BILF1 ECL2 mutants harboring L167G-N168G-R169G mutation with G170-P171-N172 deletion, L167E-N168A-R169D-G170D-P171R-N172Y-M173I mutation, and R175D-E176R-G177F-P178Y-T179P-K180N mutation, respectively. ECLCXCR4ab is a combination mutant of ECLCXCR4a and ECLCXCR4b. See also Figure S5A. IP3 accumulation was measured in HEK293 cells expressing GαΔ6qi4myr and transfected with 0, 0.3, 0.6, 1.3, 2.5, 5, 10, 30, or 50 ng plasmid DNA/well of each BILF1 construct along with the same concentrations of the empty vector (negative control). The left panel shows the gene dose-dependent signaling as an overlaid line graph, and the right panel shows the values at 10 ng DNA/well condition as a bar graph subjected to statistical tests. Normalization is performed at 10 ng wild-type BILF1 DNA/well as 100% Gi signaling. (E) Total protein expression of wild-type and the ECL2 mutant BILF1. ELISA assay was performed on permeabilized HEK293 cells using 0, 10, 30, or 50 ng DNA/well of each FLAG-tagged BILF1 construct and the empty vector (negative control). The left panel shows the gene dose-dependent protein expression as an overlaid line graph, and the right panel shows the values at 50 ng DNA/well condition as a bar graph for statistical tests. Normalization is performed at 50 ng wild-type BILF1 DNA/well as 100% total protein expression. Mutant labeling on x-axis is colored in black: wild-type-like expression, red: higher expression, blue: lower expression. The experiments were performed at least three times in duplicates. The squares in the line graphs and the bars in the bar graphs indicate mean of the relative experimental values. The error bars represent standard errors of mean (SEM), and statistical significance was calculated using Student t-test; ** p < 0.01.

