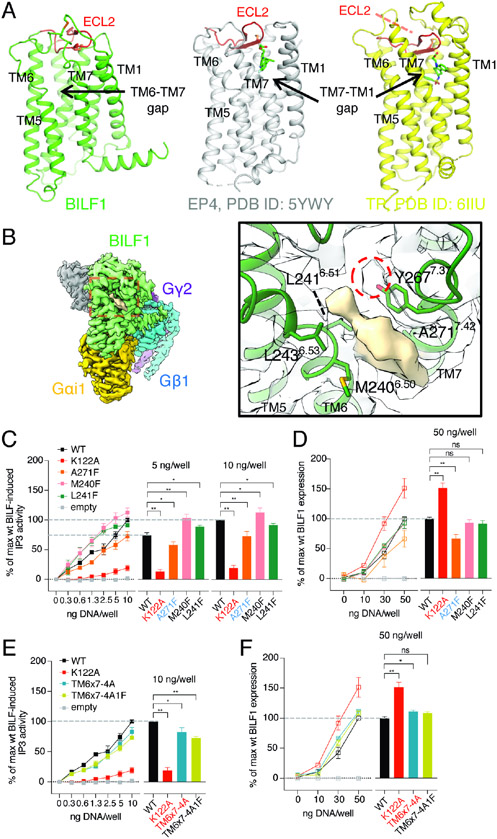
Figure 3. BILF1 has topological similarities to lipid GPCRs but shows a ligand-independent Gi activity.
(A) Structural comparison between BILF1 (green), prostaglandin E2 receptor 4 (EP4, gray, PDB ID: 5YWY), and thromboxane receptor (TP, yellow, PDB ID: 6IIU). The cartoon models are displayed side-by-side from the side view with disulfide bond-forming cysteines shown as sticks. The ECL2s are colored in red. (B) An assigned density observed between TM6 and TM7. The overall cryo-EM map is shown at the left panel with the red dashed-square closed-up in the right panel, where the surface representation of the unassigned density (wheat) and the surrounding BILF1 structure are display. The cartoon BILF1 model (dark green) and the amino acid residues contacting the unassigned density are shown as sticks with the overlaid cryo-EM density (white). The red dashed circle indicates an extra cryo-EM density continuous from the Y267 sidechain. The map contour level is set to 3.8σ. (C, E) Gi signaling of wild-type and the TM-gap mutant BILF1. IP3 accumulation was measured in HEK293 cells expressing GαΔ6qi4myr, with 0, 0.3, 0.6, 1.3, 2.5, 5, or 10 ng/well of each construct transfected as indicated in the figures. TM6x7-4A and TM6x7-4A1F donate the BILF1 variants harboring M240A-L241A-L243A-Y267A and M240A-L241A-L243A-Y267A-A271F mutations, respectively. The left line graphs show the gene dose-dependent signaling, and the right bar graphs show the relative values at the 5 ng or 10 ng DNA/well conditions subjected to statistical tests. Normalization is performed at 10 ng wild-type BILF1 DNA/well as 100% Gi signaling. (D, F) Total expression of wild-type or the mutant BILF1. The left line graphs show the gene dose-dependent protein expression at 0, 10, 30, or 50 ng DNA/well measured by anti-FLAG ELISA, and the right bar graphs show the relative values at the 50 ng DNA/well condition for statistical tests. Normalization is performed at 50 ng wild-type BILF1 DNA/well as 100% total expression. Mutant labeling on x-axis is colored in black: wild-type-like expression, red: higher expression, blue: lower expression. The experiments were performed at least three times in duplicates. The squares in the line graphs and the bars in the bar graphs indicate mean of the relative experimental values. The error bars represent standard errors of mean (SEM), and statistical significance was calculated using Student t-test; ** p < 0.01, * p < 0.05.

