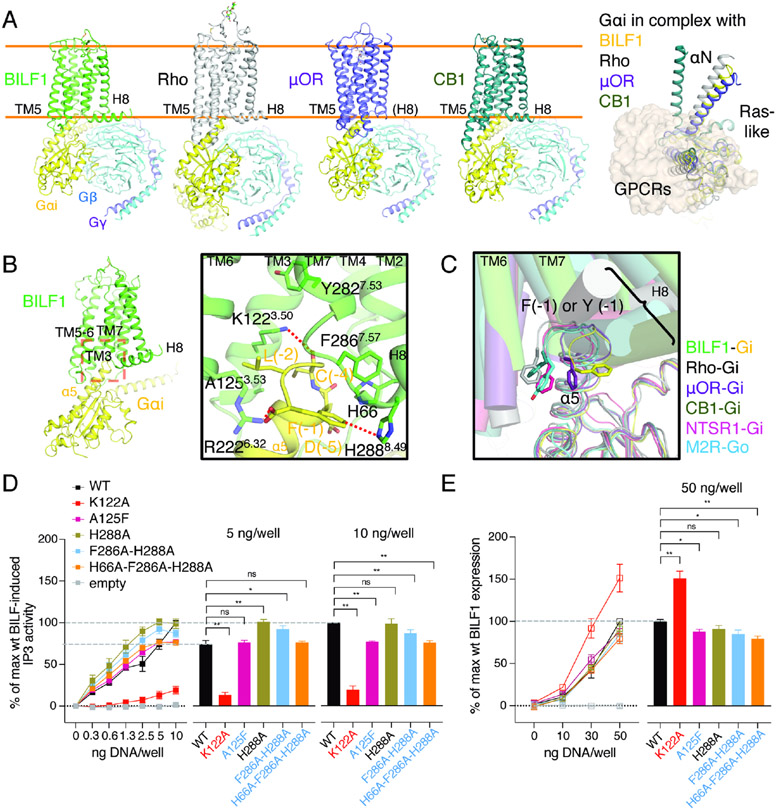
Figure 5. The BILF1-Gαi interface shows overall similarities and local differences to endogenous GPCR-Gi complexes.
(A) Structural comparison among the Gi complexes with either viral or mammalian GPCRs. Cartoon models of BILF1 (green), Rho (gray, PDB ID: 6CMO), μ-opioid receptor (μOR, purple, PDB ID: 6DDE) and cannabinoid receptor-1 (CB1, dark green, PDB ID: 6N4B) complexed with Gi heterotrimer (Gαi1: yellow, Gβ1: cyan, Gγ2: purple) are shown side-by-side on the left panel. ScFv16 is omitted for clarity. Orange lines indicate approximate cell membrane boundaries. A top-down view of their structural superimposition is displayed on the right with all the GPCRs shown as the transparent wheat surface representation. The Gβ1γ2 subunit is omitted for clarity, and the Gαi subunit is colored in yellow (BILF1), gray (Rho), purple (μOR), and dark green (CB1). For the superimposition, structural alignment is based on α carbons (Cα) of residue 3.37 - 3.51 (generic GPCR numbering). (B) Interaction between the intracellular pocket of BILF1 (green) and the C-terminal region of Gαi1 (yellow). The close-up view of the red dashed box on the overall BILF1-Gαi1 model is displayed in the black square. C-terminal F(−1) is trapped by the aromatic cluster around the TM7-H8 turn and ICL2, and the C-terminal carboxylate is interacting with R2226.32. Polar and aromatic interactions with <4 Å distance are highlighted with red dashed lines. (C) Recognition of C-terminal α5 helix of Gαi/o by viral or mammalian GPCRs in their canonical binding mode. In addition to the four structures superimposed in (A), the neurotensin receptor-1 (NTSR1)-Gi (light purple, PDB ID: 6OS9) and muscarinic acetylcholine receptor M2 (M2R)-Go (cyan, PDB ID: 6OIK) are superimposed. The helices in GPCRs are shown as transparent cylinders, and Gα chains are shown as thin lines. The structures are aligned using Cα of Gαi/o proteins. (D) Effect on Gi signaling by the BILF1 mutations at the BILF1-Gαi interface. The left line graphs show BILF1 gene-dose IP3 accumulation measured in HEK293 cells expressing GαΔ6qi4myr and transfected with the constructs indicated in the figures. Data were normalized to the 10 ng wild-type BILF1 DNA/well condition. The right bar graphs show the relative values at the 5 ng or 10 ng DNA/well conditions subjected to statistical tests as indicated in the figures. (E) Total expression of wild-type and the mutant BILF1. The left line graphs show gene-dose BILF1 expression measured by anti-FLAG ELISA on permeabilized HEK293 cells transfected with the same constructs as the signaling assay, but normalized to the 50 ng wild-type BILF1 DNA/well condition. All cell-based assay were performed at least three times in duplicates. The squares in the line graphs and the bars in the bar graphs indicate mean of the normalized experimental values. The error bars represent standard errors of mean (SEM), and statistical significance was calculated using Student t-test; ** p < 0.01, * p < 0.05.

