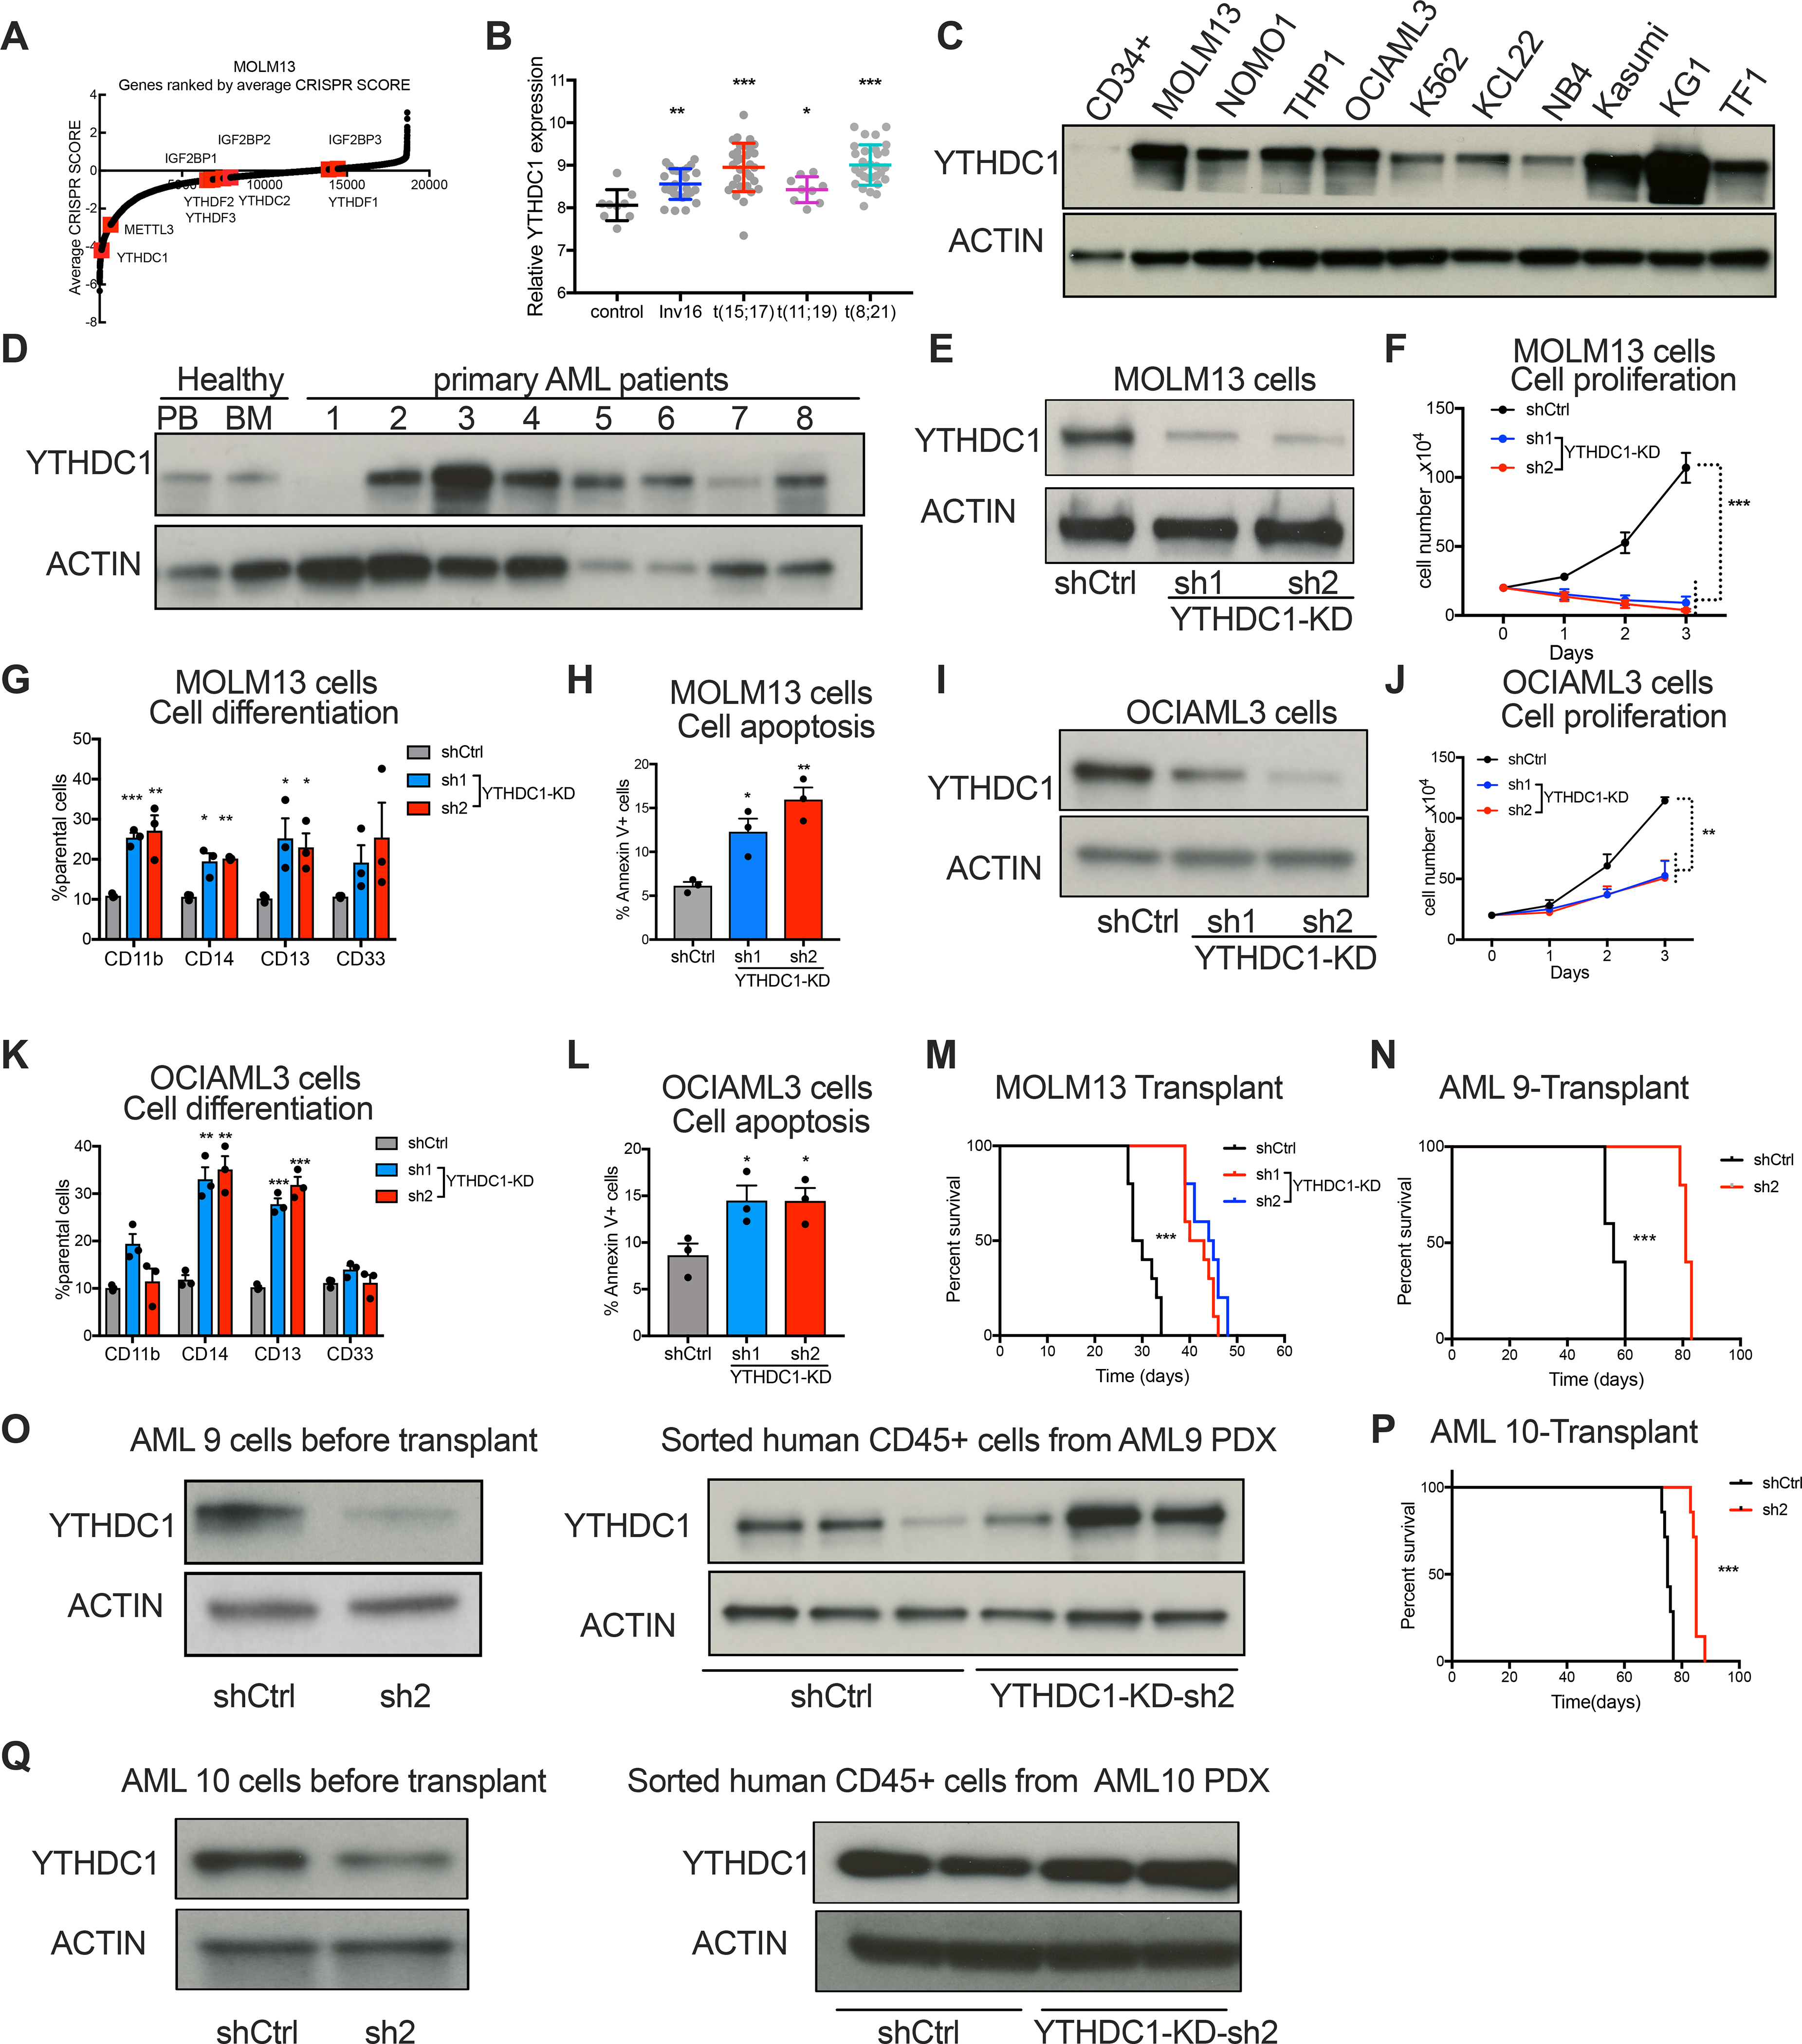
Figure 1: YTHDC1 is required for leukemia cell survival.

(A) CRISPR score rank of the m6A “readers” in MOLM13 cells. m6A readers are highlighted in red and METTL3 was a control. (B) YTHDC1 expression in human primary AML cases with inv(16), t(8;21) t(15;17), t(11;19) or normal controls (NC). Data is from GSE34184 and GSE30285. (C) Immunoblot analysis YTHDC1 protein expression in AML cell lines compared to normal HSPCs (CD34+ cells). (D) Immunoblot analysis of YTHDC1 protein abundance in primary AML patient cells and peripheral blood and bone marrow from healthy donors. (E-H) MOLM13 cells were transduced with lentiviruses expressing control shRNA(shCtrl) or two independent shRNAs targeting YTHDC1 (sh1 and sh2; YTHDC1-knockdown). n=3 independent replicants. (E) Representative immunoblot for control and YTHDC1 depleted MOLM13 cells. (F) Cell proliferation of control versus YTHDC1 depleted MOLM13 cells. (G) Myeloid differentiation of cells was quantified by flow cytometry. (H) Apoptotic cells were determined by flow cytometry analysis of Annexin V and 7-AAD staining. (I-L) OCIAML3 cells were transduced with lentiviruses expressing control shRNA(shCtrl) or two independent shRNAs targeting YTHDC1 (sh1 and sh2; YTHDC1-knockdown). n=3 independent replicants. (I) Immunoblot of YTHDC1 expression in OCIAML3 cells. (J) Cell proliferation of OCIAML3 cells upon YTHDC1 depletion. (K) Myeloid differentiation of OCIAML3 cells was determined by flow cytometry. (L) Apoptotic cells were determined by flow cytometry analysis of Annexin V and 7-AAD staining. (M) Survival curve of NSG mice transplanted with control or YTHDC1 depleted MOLM13 cells by shRNA. n=10 for each group. (N) Survival curves of NSG mice xeno-transplanted with human primary AML deprived cells (AML 9 cells) that were transduced with control or YTHDC1-targeting shRNA. n=5 for each group. (O) Immunoblot of PDX cells before injection to NSG mice or after xenograft in (N). (P) Survival curves in of NSG mice xeno-transplanted with AML 10 cells that were transduced with control or YTHDC1-targeting shRNA. n=10 for each group. (Q) Immunoblot of PDX cells before injection to NSG mice or after xenograft in (P). Error bars, s.e.m. *p<0.05, **p<0.01, ***p<0.001, two-tailed t test.
