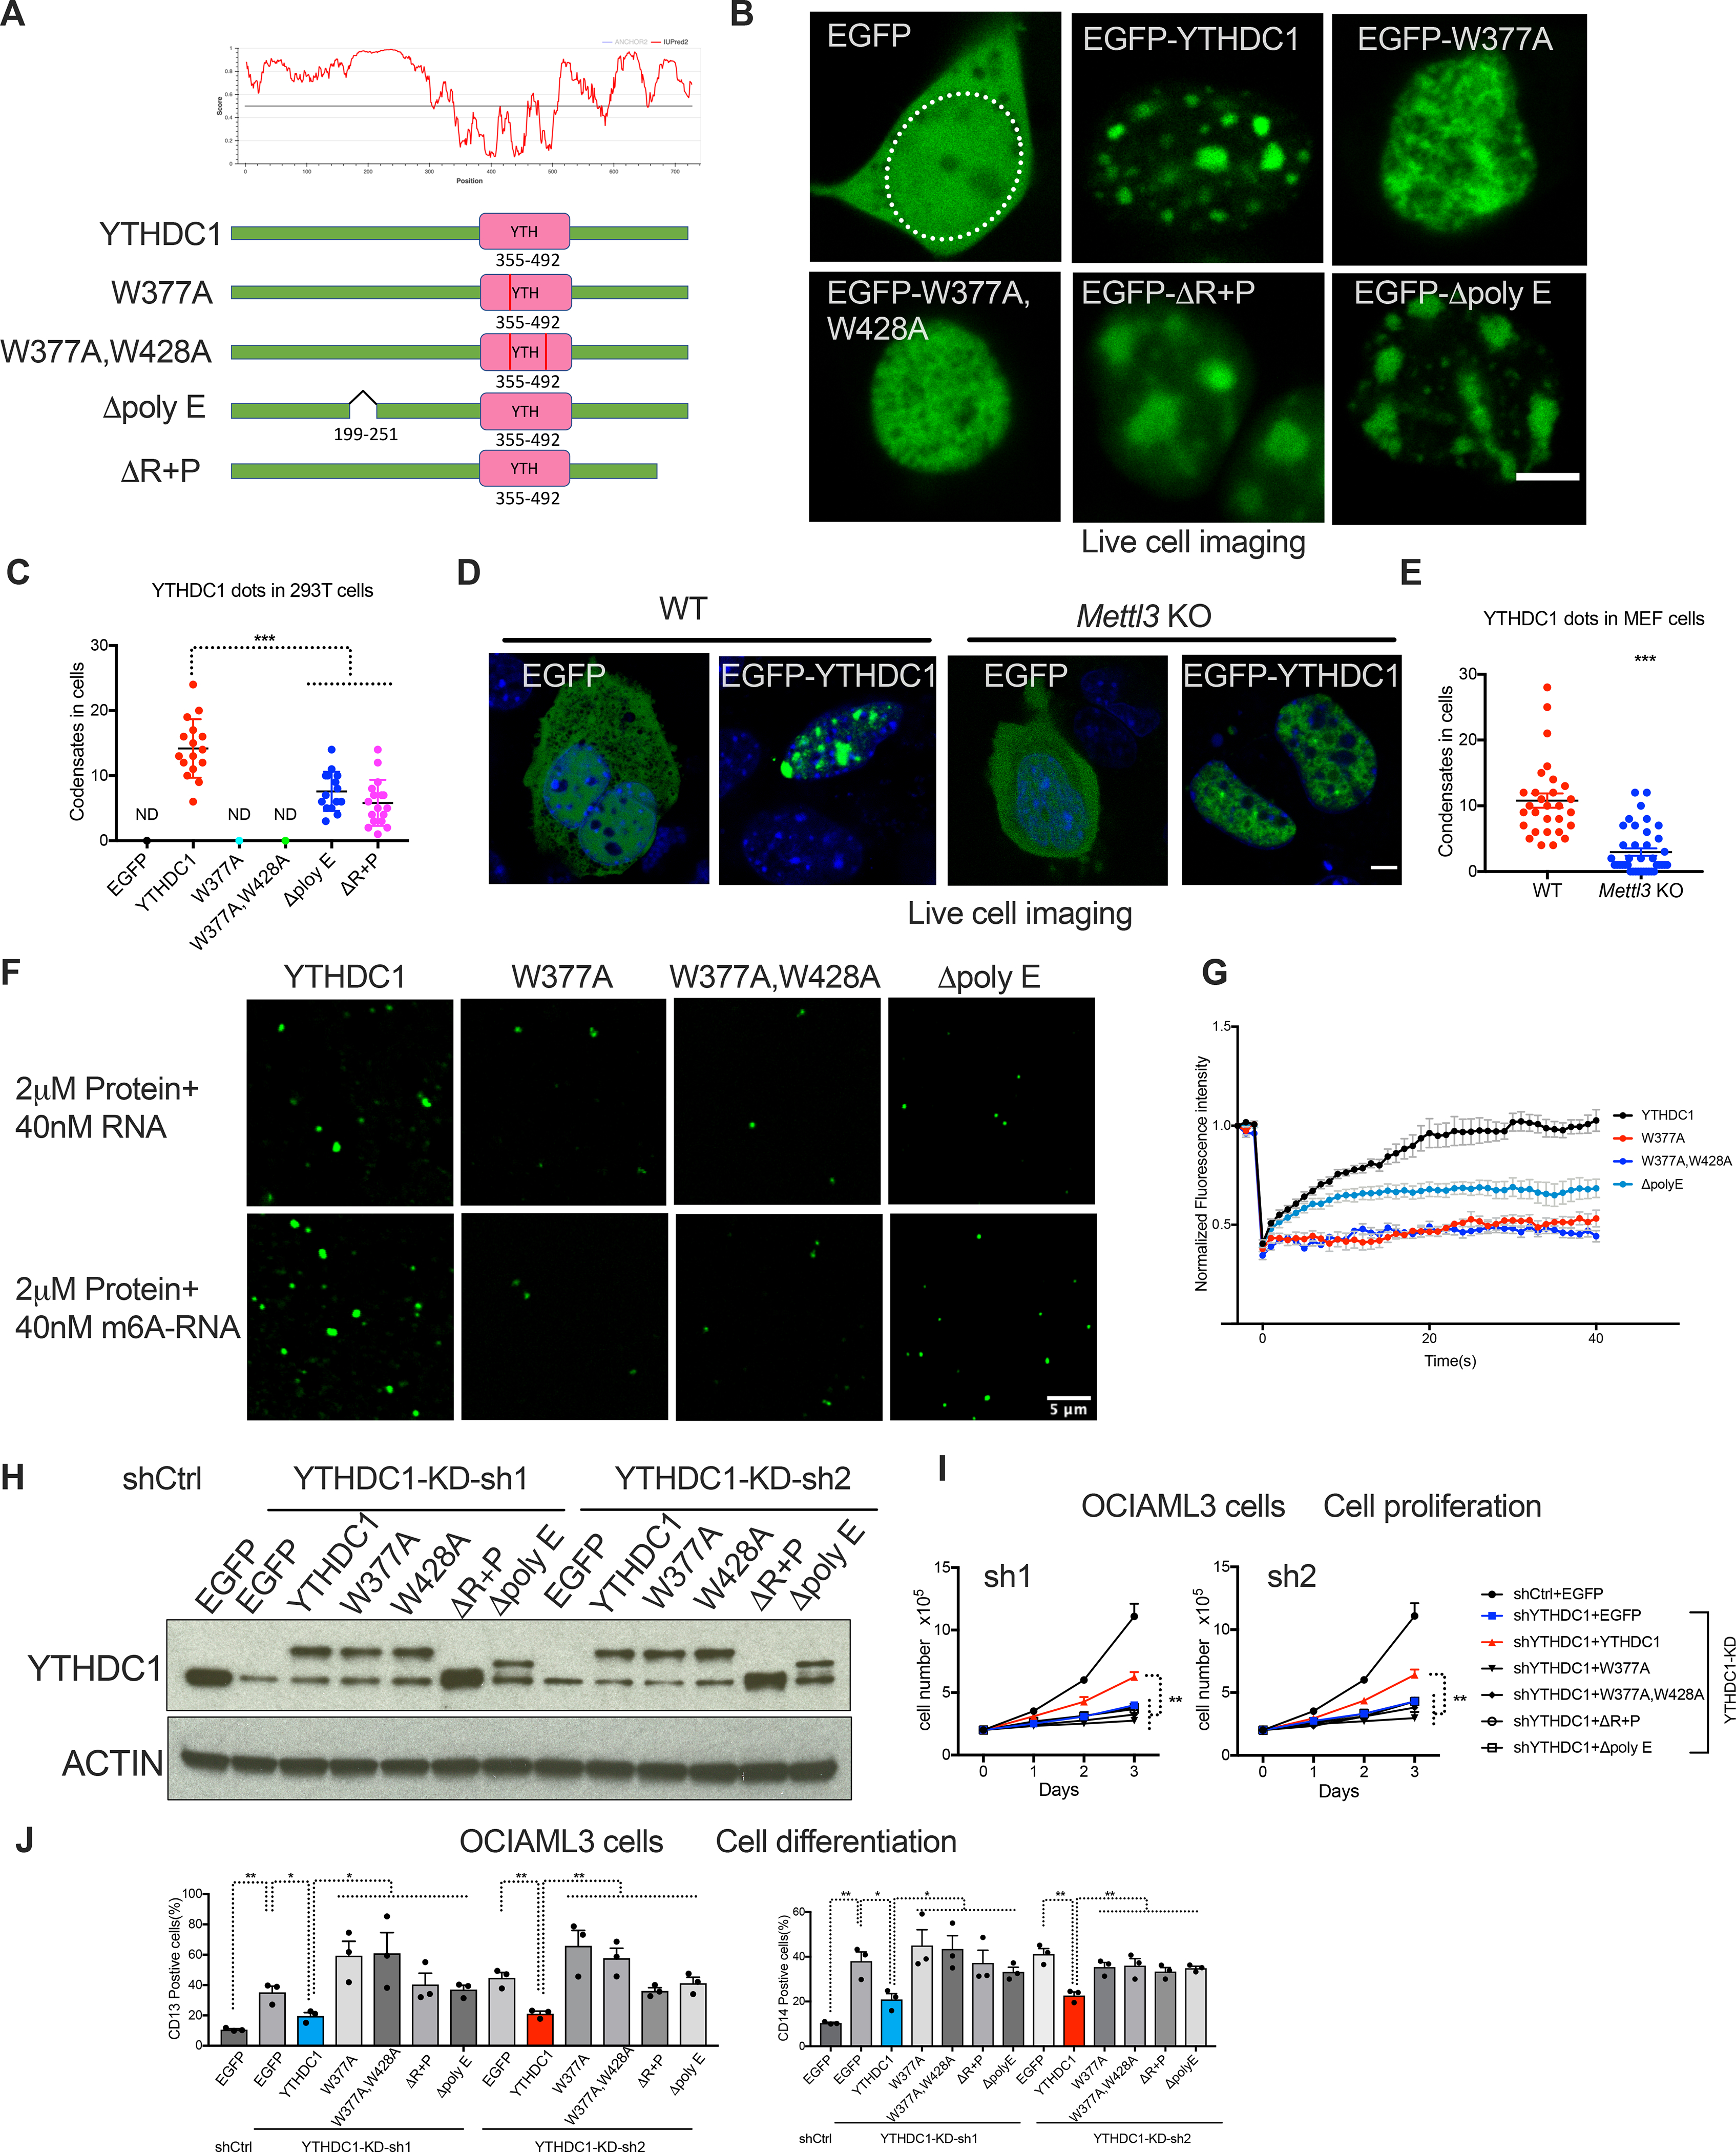
Figure 3: m6A dependent nYACs are essential for leukemia cell survival and differentiation.

(A) Top: Graphs plotting intrinsic disorder for YTHDC1. PONDR (Predictor of Natural Disordered Regions) VSL2 scores are shown on the y axis, and amino acid positions are shown on the x axis. Bottom: Schematic of EGFP fused WT YTHDC1 and different YTHDC1 mutants used in this study. Pink boxes indicate the YTH domain. Green boxes indicate predicted IDRs. (B) Live imaging of 293T cells expressing EGFP fused WT YTHDC1 and different YTHDC1 mutants as indicated. The white line highlights the cell nuclear. Scale bars, 5μm. (C) Quantitative summary of YTHDC1 condensates in 293T cells related to (B). ND: not detected. Mean+s.e.m, n=16,15,17 from 3 independent experiments. (D) Live imaging of WT and Mettl3 KO MEF cells transfected with EGFP–YTHDC1 or EGFP as control. Scale bars, 5μm. (E) Quantitative summary of YTHDC1 condensates in WT and Mettl3 KO cells related to (D). Mean+s.e.m, n=29,39 from 2 independent experiments. (F) In vitro phase separation of YTHDC1 and its mutants proteins. Top: 2μM YTHDC1 protein plus 40nM 65-nucleotide non-m6A RNA. Bottom: 2μM YTHDC1 protein plus 40nM 65-nucleotide RNA containing 10 m6A nucleotides. Scale bars, 5μm. (G) Quantification of FRAP data for droplets of YTHDC1 and its mutants plus m6A RNA as indicated. The bleaching event occurs at t = 0 s. For YTHDC1 and Δpoly E, n=9; for W377A, W428A, n=6. (H-J) OCIAML3 cells overexpressed with EGFP (control), WT YTHDC1 or different YTHDC1 mutants as indicated were followed endogenous YTHDC1 knockdown by viral transduction. n=3 independent experiments. (H) Representative immunoblot probed with indicated antibodies. (I) Cell numbers measured over time of OCIAML3 cells. (J) Quantitative summary of myeloid differentiation determined by flow cytometry using CD13 (left) and CD14 (right) in OCIAML3 cells.
Error bars, s.e.m. *p<0.05, **p<0.01, ***p<0.001, two-tailed t test.
