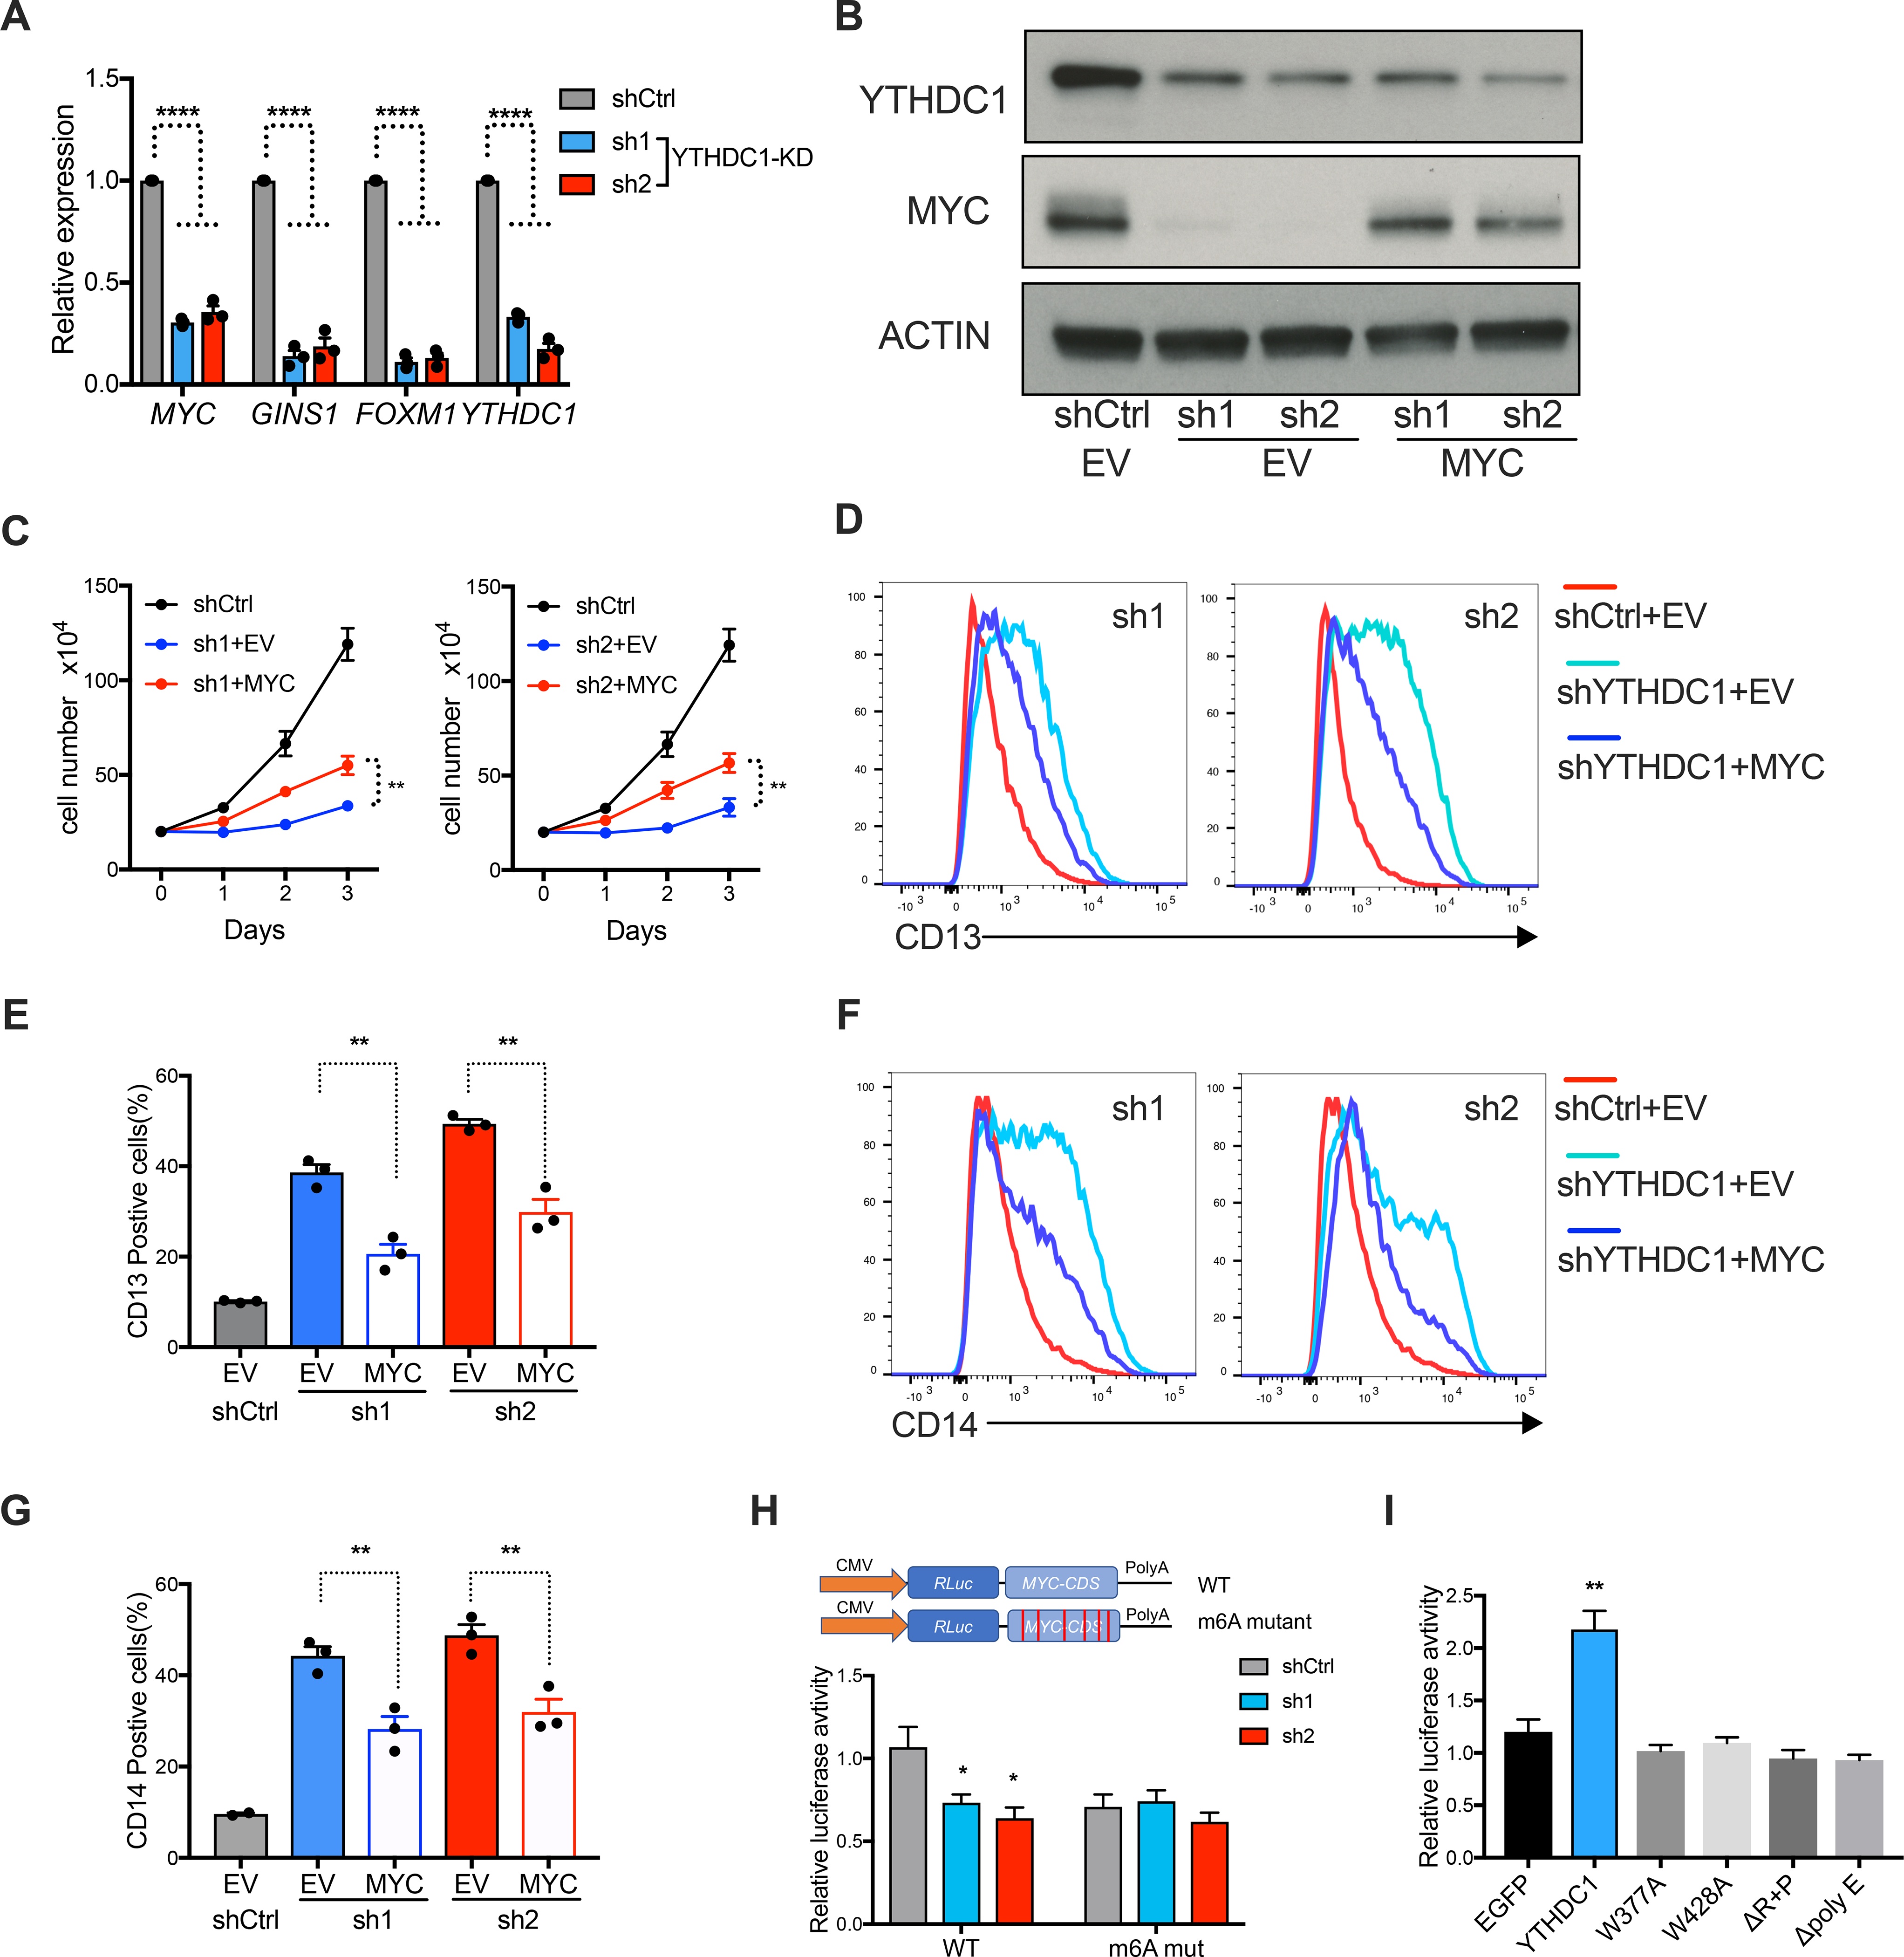
Figure 6: MYC is a functional target of YTHDC1 in AML.

(A) qPCR to measure mRNA expression of YTHDC1 targets in MOLM13 cells upon YTHDC1 depletion. n=3 independent experiments. (B-G) OCIAML3 cells overexpressing empty vector (EV) or MYC as indicated were followed with endogenous YTHDC1 knockdown by viral transduction. EV is used as control for overexpression. shCtrl is used as control for shRNAs. n=3 independent experiments. (B) Representative immunoblot in OCIAML3 cells probed with indicated antibodies. (C) Cell proliferation of OCIAML3 cells. (D-G) Myeloid differentiation of OCIAML3 cells. (D) and (F): Representative flow plot to show expression of myeloid marks CD13 and CD14. (E) and (G): Quantitative summary of myeloid differentiation using CD13 (E) and CD14 (G) determined by flow cytometry. (H) Up: Diagram of vector used in luciferase reporter assay. Bottom: Luciferase reporter assay using the original MYC CDS or the m6A sites mutated MYC CDS in 293T cells. 293T cells were transfected with control or YTHDC1 shRNA constructs. Normalized luciferase activity was calculated. n=4 independent experiments. (I) Luciferase constructs are the same as (H). 293T cells were transfected with control vector (EGFP), YTHDC1, or indicated YTHDC1 mutants. Normalized luciferase activity was calculated. n=4 independent experiments. Mean and s.e.m are shown (*, P < 0.05; **, P < 0.01; ***, P < 0.001, ****, P < 0.0001). two-tailed t test.
