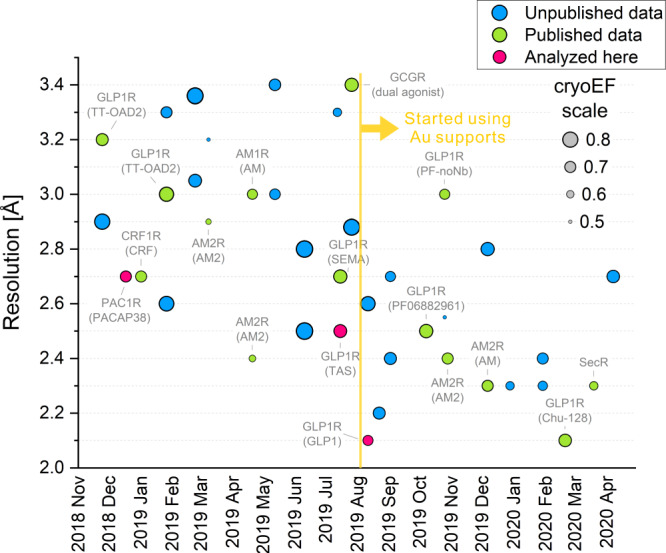
Fig. 3. Resolution history of our cryo-EM GPCR reconstructions.

Over the year and a half period shown in the plot, there is a general trend towards better resolution with a significant improvement in August 2019, when the sample supports were switched from holey carbon films to gold foil grids. The size of each dot represents the cryo-EM efficiency quantity (cryoEF, see values in the legend) that estimates the uniformity of the particle orientation distribution. A value of ~0.5 represents an angular distribution that is barely sufficient for producing a usable 3D map and a value of 1 corresponds to an ideal uniform distribution. Published results are annotated and the three datasets analyzed in this study are highlighted in pink.
