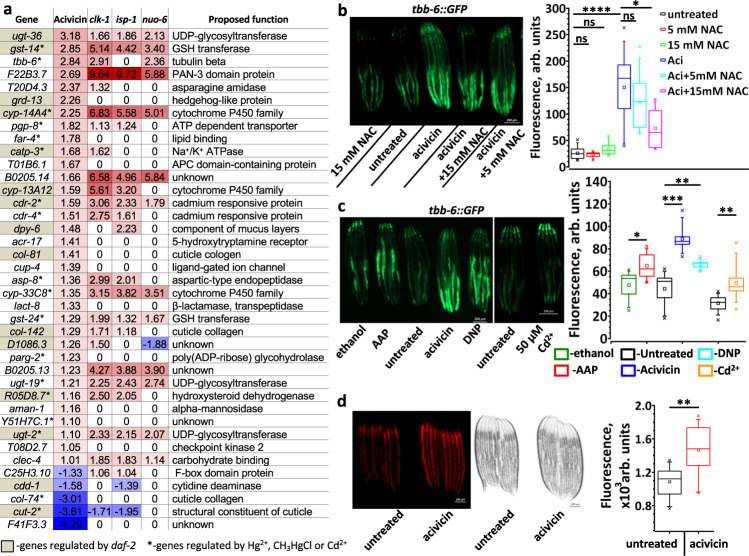
Fig. 6. GSH restriction upregulates mitochondrial ROS signaling in C. elegans.
a Genes induced by acivicin and by life-extending mitochondrial mutations overlap significantly. Numbers represent the expression log2 fold change compared to wt or untreated worms. See full list of differentially regulated genes in Supplementary Data 2. Data for gene expression in daf-2, clk-1, isp-1 and nuo-6 are from32. Up- and down-regulated genes are indicated, respectively, in red and blue. Genes which are regulated in daf-2 worms are highlighted in gray. *-genes regulated by Hg2+, CH3HgCl or Cd2+. Statistical significance for the overlap between sets upregulated more than two folds by: acivicin (34 genes) and nuo-6 (1285 genes) – 22 genes overlap, RF = 10.3, p value = 7.93e−19; acivicin and clk-1 (328 genes) – 13 genes overlap, RF = 23.9, p value = 2.48e−15; acivicin and isp-1 (609 genes) – 19 genes overlap, RF = 18.8, p value = 9.01e−21. RF – representation factor is the number of overlapping genes divided by the expected number of overlapping genes and p is normal approximation of hypergeometric probability. b, c Representative fluorescent images (left panels) and quantifications (right panels) demonstrating the tbb-6 counter-regulation by acivicin (n = 70) and NAC (n = 30-55) (b) and the tbb-6 induction by acetaminophen (AAPh, 20 mM, n = 35), acivicin (75 µM, n = 35), dinitrophenol (DNP, 100 µM, n = 35), and cadmium (Cd2+, 50 µM, n = 65) (c). L4 stage worms were transferred to plates supplemented with chemicals as indicated, and incubated for 24 h at 20 °C before imaging. n = 30–70 worms over three independent experiments. See also Supplementary Tables 8 and 9. d Representative fluorescent and bright light images (left panels) and quantifications (right panel) demonstrating mitochondrial ROS staining by MitoTracker CM-H2X in control and acivicin-treated worms (n = 79). Worms developed till stage L3 on control and acivicin supplemented plates. See also Supplementary Table 10. In b, c and d the box plots indicate median (middle line), 25th, 75th percentile (box) and 5th and 95th percentile (whiskers) as well as maximum, minimum and mean (single points). In all graphs p values are: n.s. not significant; *p < 0.05; **p < 0.01; ***p < 0.001; ****p < 0.0001; two-tailed t-tests.

