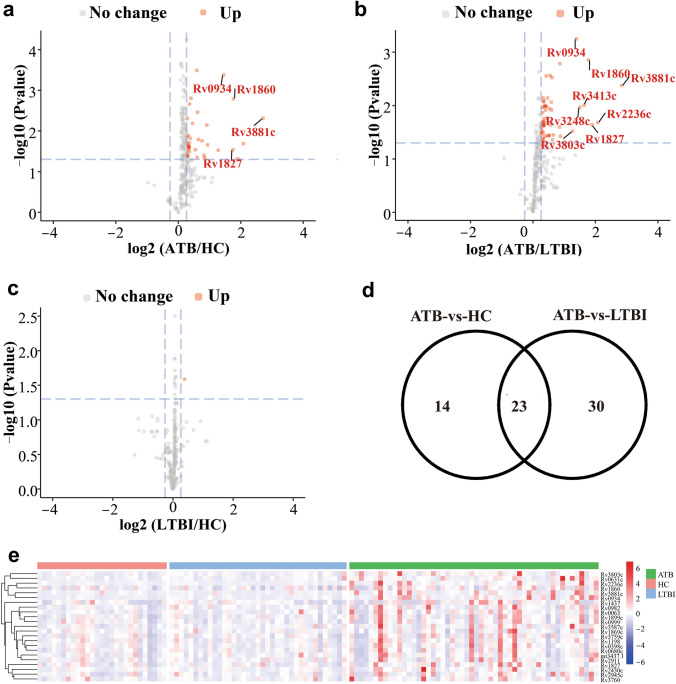
Figure 2.
Microarray-based selection of antigens present at different levels in serum samples from individuals with active TB or LTBI or healthy controls. (a–c) Volcano plots. Differential analysis of serum samples from the ATB and LTBI groups (a), ATB and HC groups (b) and the LTBI and HC groups (c). Volcano plots show the change in transformed p-value (− log10) against the log2 ratio in the three groups of serum samples. Blue dashed lines: cut-off values (ratio > 1.2 and p-value < 0.05). Red dots: antigens present at increased levels. Important proteins present at increased levels are labeled. (d) Venn diagram. Twenty-three antigens present at higher levels in the ATB group were present in both the ATB-vs-HC and ATB-vs-LTBI comparisons. (e) Hierarchical clustering of the 23 differential proteins (from (d)) in the ATB, LTBI and HC groups. Color bar: signal intensity of the antigen. The heatmap was drawn using the ‘pheatmap’ package (v1.0.12)23.

