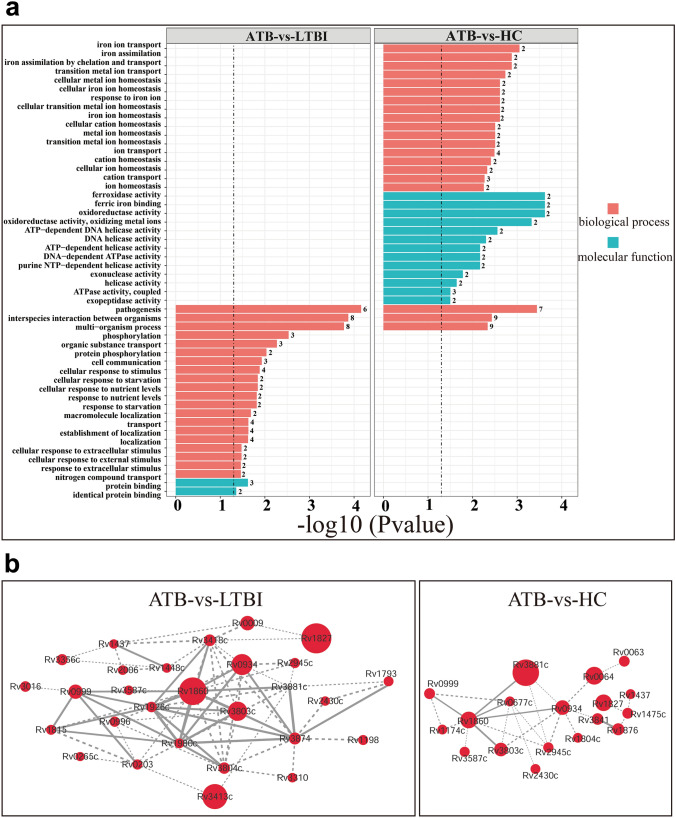
Figure 3.
Data enrichment analysis of differential proteins according to molecular function and biological process using Gene Ontology. (a) Gene Ontology enrichment of differential antigens according to biological process (red) and molecular function (green). Y-axis: name of the enrichment GO term, X-axis: transformed P-values (−log10) (threshold: 0.05). Left panel: ATB-vs-LTBI, right panel: ATB-vs-HC. (b) Network analysis of differential proteins. The protein–protein interaction networks of differential proteins were analyzed by STRING, and the network was visualized using Cytoscape. The minimum required interaction score was set as the highest confidence (0.400) and the disconnected nodes in the network were hidden. Node size: the degree of difference (the larger the circle, the greater the ratio of ATB/HC or ATB/LTBI). Dashed line: interaction score < 0.7, solid line interaction score > 0.7. Left panel: ATB-vs-LTBI, right panel: ATB-vs-HC.

