
Figure 2.
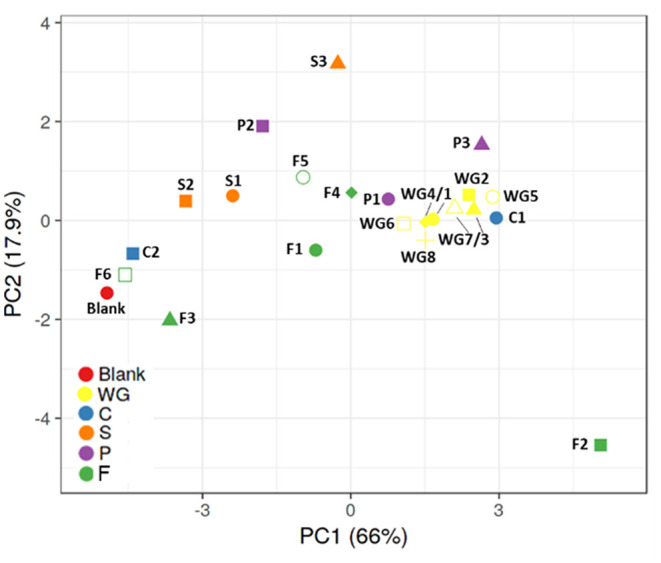
Principal component analysis (PCA) plots representing metabolic (pH, gas, SCFA, BCFA, lactate) and qPCR (bifidobacteria, lactobacilli, Bacteroidetes, Firmicutes) data obtained for batch assays with fecal samples of three healthy donors exposed to control and 22 fiber products. BCFA, branched-chain fatty acid; SCFA, short-chain fatty acid. WG1, whole grain millet; WG2, whole grain oat; WG3, medium grain whole brown rice; WG4, whole grain soft white wheat; WG5, whole grain barley; WG6, whole grain corn; WG7, waxy whole grain soft white wheat; WG8, waxy hulless barley; C1, oat beta glucan; C2, rice fiber; S1, whole brown flaxseed; S2, hemp/hemp hearts; S3, psyllium fiber; P1, whole brown lentils; P2, soy fiber; P3, pea fiber; F1, kiwi fiber; F2, inulin; F3, bamboo fiber; F4, konjac flour; F5, apple fiber; F6, algal beta glucan isolate.