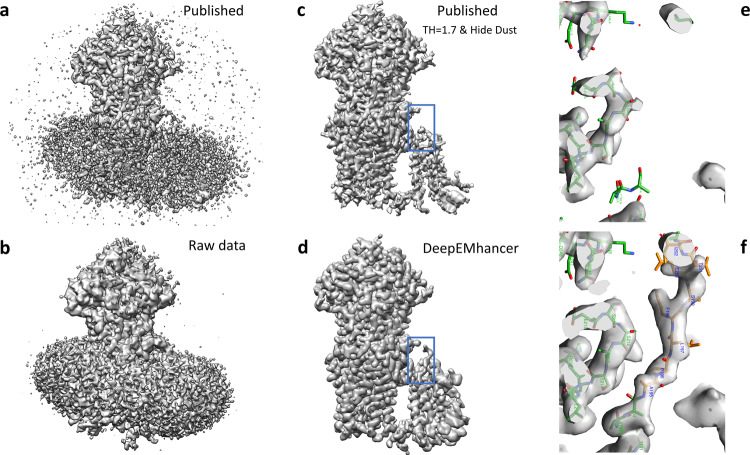
Fig. 4. DeepEMhancer results on testing map EMD-7099.
a Lateral view of the published map (B-factor sharpened, shown at the threshold recommended by the authors). b Lateral view of the raw data map obtained from the half maps that was used as input for DeepEMhancer. c Lateral view of the published map after rising the threshold and removing the small connected components so that the signal coming from the lipids was suppressed. As a collateral consequence, some densities corresponding to the protein were also lost. d Lateral view of the map obtained with DeepEMhancer. e Zoom-in of the region marked with a blue box in c. f Zoom-in of the region marked with a blue box in d, in which DeepEMhancer post-processed map, contrary to the published map, shows the densities corresponding to a missing loop in PDB 6bhu chain A. As a result, the residues A195 to I203 have been de novo modeled (new residues depicted in yellow, published in green).

