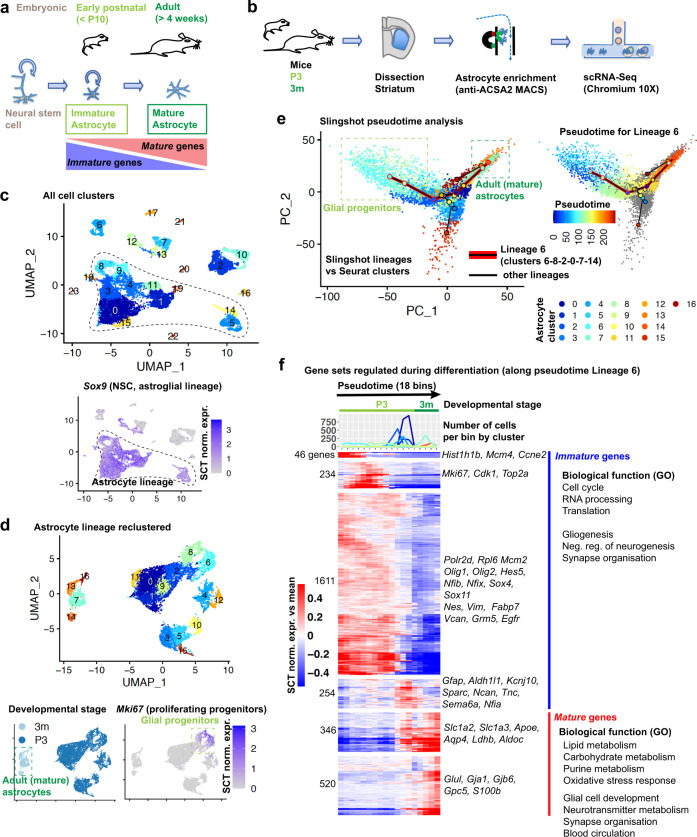
Fig. 1. Astrocyte maturation in vivo proceeds through intermediate stages.
a Current model of astrocyte differentiation in mice: neural stem cells generate immature astrocytes that proliferate until around postnatal day 10 (P10) and become fully mature astrocytes by 4 weeks of age. b Approach for single-cell RNA-Seq analysis of striatal astrocyte maturation: immature astrocytes from the striatum of postnatal day 3 (P3) mice and mature astrocytes from the striatum of 3-months-old (3m) mice are enriched by magnetic bead assisted cell sorting (MACS) for the astrocyte-specific ACSA2 antigen, followed by single-cell RNA sequencing (scRNA-Seq). c Uniform Manifold Approximation and Projection (UMAP) dimension reduction plots of combined single-cell transcriptomes from postnatal and adult striatum. Expression of Sox9 is projected on the UMAP plot in the lower graph. d UMAP plot of Sox9+ cells highlighted in (c) and reclustered. The lower graphs show cells’ origin by developmental stage and expression of MKi67 projected on UMAP plot. e Pseudotime analyis of clusters in (d) shown projected on a principle component analysis (PCA) plot. Left: cluster assignment and the lineage relationships identified by Slingshot (starting with the proliferating progenitor cluster 6). Right: pseudotime progression of cells included in the pseudotime trajectory connecting the progenitor cluster 6 with putative mature adult astrocyte clusters 7 and 14 (most different/distant along principle component 1 (PC1)), via the early postnatal clusters 8, 2 and 0 (Lineage 6). f Temporally-expressed genes along the pseudotime trajectory shown in (e). The heatmaps show the mean relative expression of each gene in all cells in each pseudotime bin (number of cells from each cluster shown above). Genes were ordered by hierarchical clustering and grouped into gene sets with similar expression patterns. Example genes and potential biological functions based on gene ontology (GO) analysis are shown. 3011 temporally expressed genes were detected with tradeSeq by comparing the 5894 cells assigned to the main pseudotime trajectory (Lineage 6) from (e). Gene expression was normalized using the Seurat SCTtransform algorithm (SCT norm. expr.). See also Supplementary Fig. 1, Supplementary Data 1.

