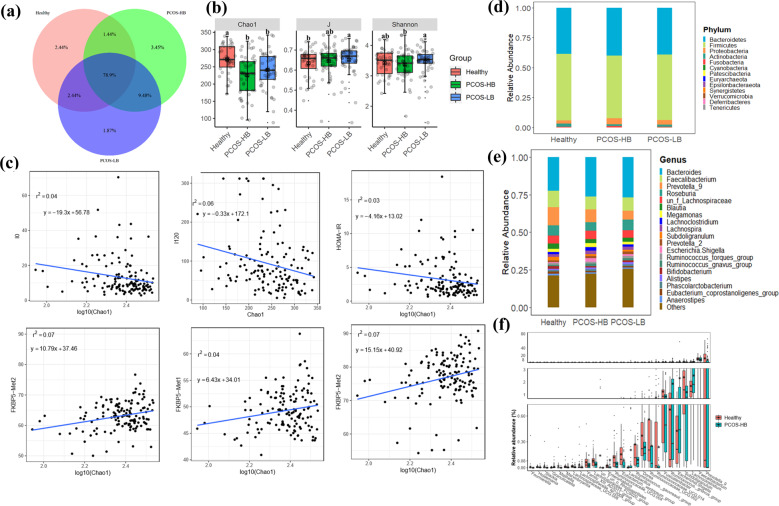
Fig. 2. Changes in bacterial diversity and community composition.
a Venn diagram showing the shared and unique OTUs among healthy, PCOS-HB and PCOS-LB subjects. b The bacterial diversity comparison among healthy subjects, and subjects with PCOS-HB and PCOS-LB, respectively. The data are shown as the mean ± SD and error bar was used. c The association between bacterial diversity and clinical indices. d Distribution of bacterial taxa at the phylum level. e Distribution of bacterial taxa at the genus level. f The distinguished bacterial genera screened by the Wilcoxon test. Letters indicate the ANOVA grouping. Red, green, and blue color represent Healthy, PCOS-HB and PCOS-LB group separately. PCOS-LB, normal BMI (BMI < 24); PCOS-HB, high BMI (BMI ≥ 24).

