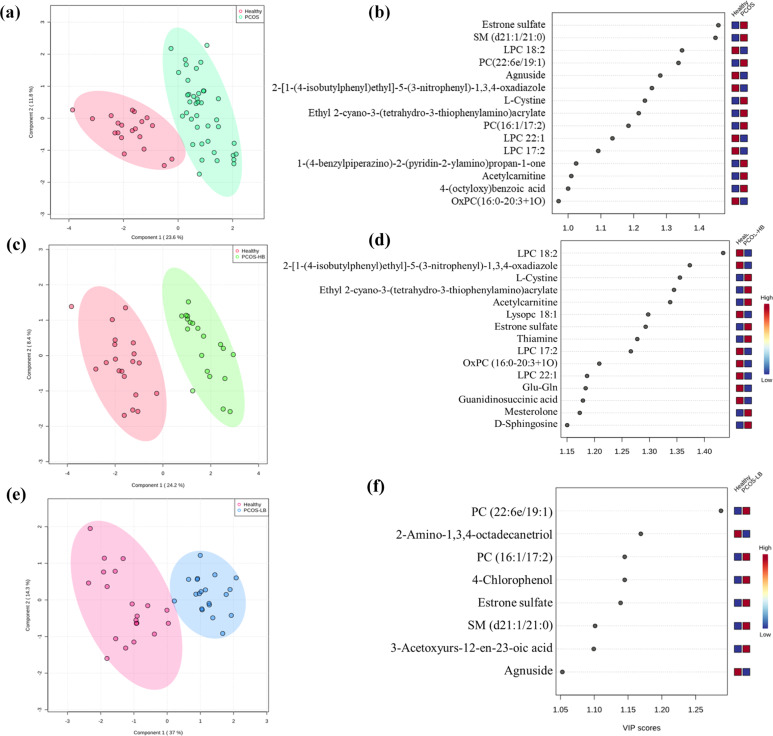
Fig. 3. Comparison of pairwise metabolite profile characteristics.
a The PLS-DA plot showing the distribution pattern difference between healthy patients and patients with PCOS. b VIP scores of PLS-DA in comparison between healthy patients and patients with PCOS. c The PLS-DA plot showing the distribution pattern difference between healthy patients and patients with PCOS-HB. d VIP scores of PLS-DA in comparison between healthy patients and patients with PCOS-HB. e The PLS-DA plot showing the distribution pattern difference between healthy patients and patients with PCOS-LB. f VIP scores of PLS-DA in comparison between healthy patients and patients with PCOS-LB. VIP scores were used to rank the discriminating power of different taxa between the PCOS and control groups. A taxon with a VIP score of >1 was considered important in the discrimination. Red, green, and blue color represent Healthy, PCOS-HB and PCOS-LB group separately.

