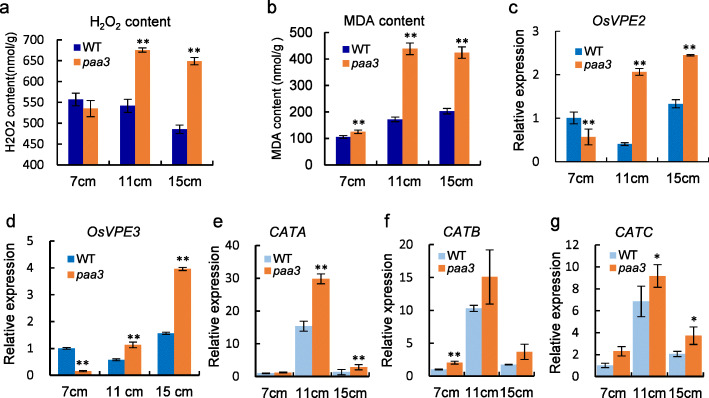
Fig. 6.
Cell death-related Events are induced in paa3. a: Measurement of H2O2 content in panicles of the 7, 11, and 15 cm stages in WT and paa3. b: Measurement of MDA content in panicles of the 7, 11, and 15 cm stages in WT and paa3, showing overaccumulation of ROS during late development stages in paa3. c: Expression level of OsVPE2 in WT and paa3 panicles at the 7, 11, and 15 cm stages. d: Expression levels of OsVPE2 and OsVPE3 in WT and paa3 panicles at the 7, 11, and 15 cm stages, which showed PCD from the stage of 11 cm. e–g: Relative expression of CATA, CATB, and CATC isozymes. (rice ACTIN was used as the internal control). * indicates p < 0.05; ** indicates p < 0.01 (Student’s t-test)

