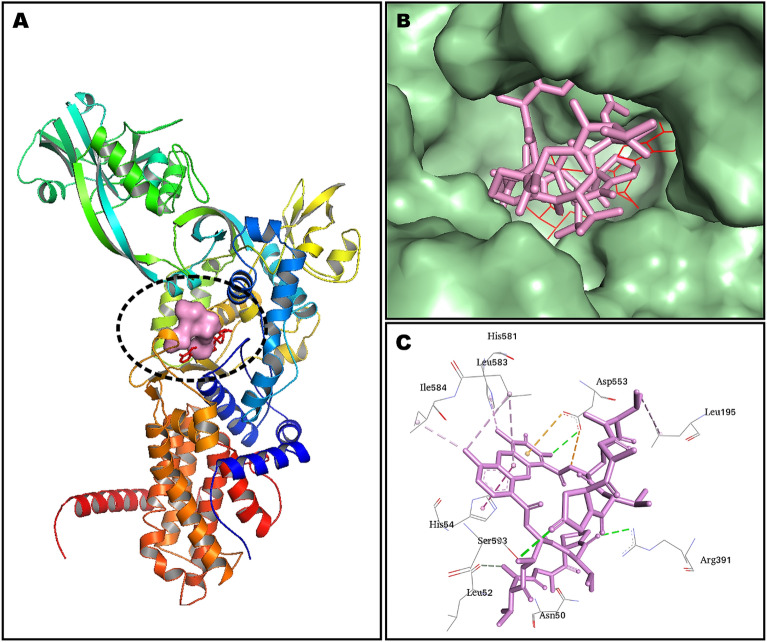
Figure 11.
Minimum energy conformation of docked compound K1 in the binding pocket of isoleucyl-tRNA synthetase (IleRS). (A) IleRS has been shown as cartoon representation while docked compound K1 has been shown as a surface in pink color; (B) Binding pocket of IleRS has been shown as surface and docked compound K2 is represented as a stick in pink while native ligand is demonstrated as line rendering in red color; (C) Binding residues are shown inline style and intermolecular interaction are shown as dotted lines. PyMoL 2.4.1 (https://pymol.org/2/) (A,B) and Biovia Discovery Studio Visualizer 2020 (C) programs were used for generating the images.

