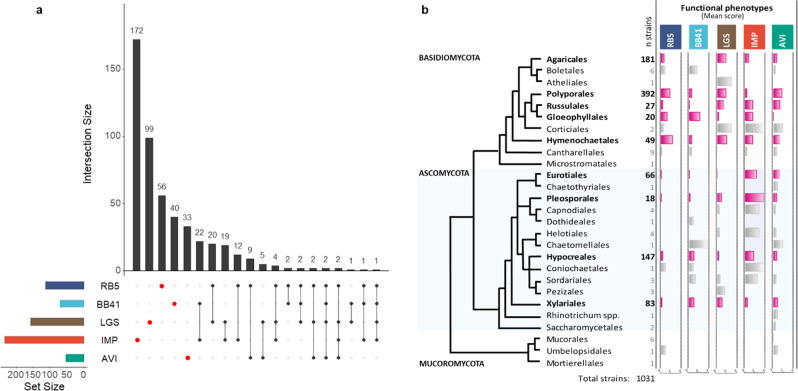
Fig. 4. Substrate-wise and phylogeny-wise distribution of the phenotypic scores of the 1031 tested fungal strains.
a UpSet plots illustrating quantitative intersection of the sets of strains showing the highest score (score 4) for each functional phenotype (the colored bars on the left-hand side indicate the total number of strains that scored a 4 for each compound). For instance, looking at IMP, out of 233 “score 4” strains, 172 scored a 4 exclusively on IMP (and not on any other compound), while 22 scored a 4 on both IMP and BB41. The figure shows that high scoring strains with a single phenotype represent the majority. b Mean scores of multi-phenotyping of 1031 natural strains belonging to 26 fungal orders mapped onto the phylogenetic tree. The numbers of analyzed strains (n samples) are indicated in the first column. Horizontal histograms show the mean scores for each fungal order for each phenotype, ranging from 0 to 4. Note that these scores reflect a functional phenotype (i.e., decolorization (RB5, BB41), oxidation (LGS), degradation (IMP), or growth (AVI)). Growth phenotypes for all strains/compounds couples are provided in Supplementary Data 2. Histograms colored in pink indicate orders for which more than ten strains were analyzed (otherwise shown in gray). The topology of the tree was built according to recent phylogenies of Fungi57–59.

