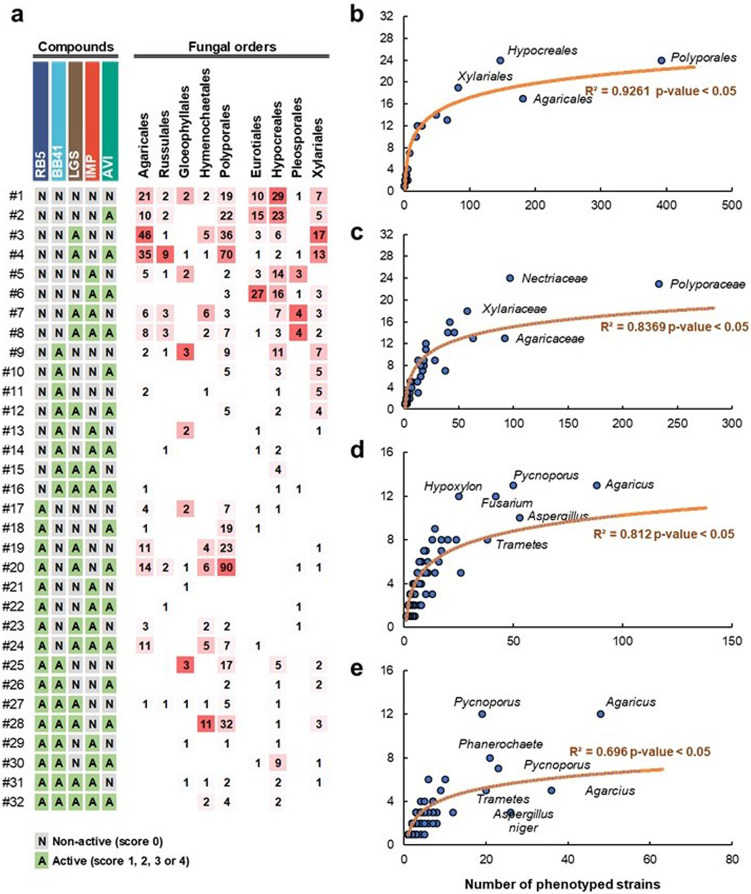
Fig. 5. Overview of the functional diversity at different taxonomic levels.
a Distribution of functional profiles at the order level. The two-level categorization of non-active (N) and active (A) substrate–strain couples evaluated on 5 different substrates yields a theoretical maximum of 32 profiles. For each fungal order, the numbers provided in the matrix represent the number of strains with a given profile (for each fungal order, a color gradient from white (only one strain) to red (maximum number of strains) has been applied to show the distribution of functional profiles in the order). As an example, 46 strains from the Agaricales order displayed the profile #3 (LGS oxidation only). b–e Logarithmic regression between the number of functional profiles observed (x axis) within a taxonomic rank (indicated in the figure) and the number of analyzed strains (y axis) in this rank, at the order (b), family (c), genus (d), and species (e) levels.

