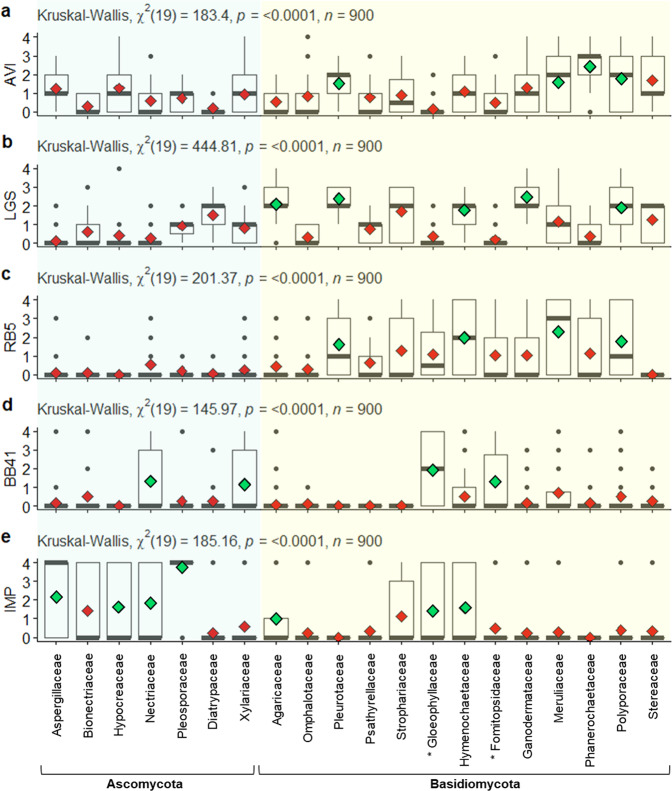
Fig. 6. Box plots showing the fungal family-dependent distribution of phenotypic scores.
For each fungal family, and each target compound (a–e), the median score (thick gray bars) and mean score (red or green diamonds) are shown. For a given target compound, green diamonds show families with a mean score significantly higher than other families. Outliers are represented by dots. Families of brown-rot fungi are marked by an asterisk. For each target compound, non-parametric Kruskal–Wallis test indicates (p value and χ2) significative differences between fungal families. Wilcoxon signed-rank test were computed to compare paired data (i.e., family to family; p values are shown in Supplementary Data 3).

