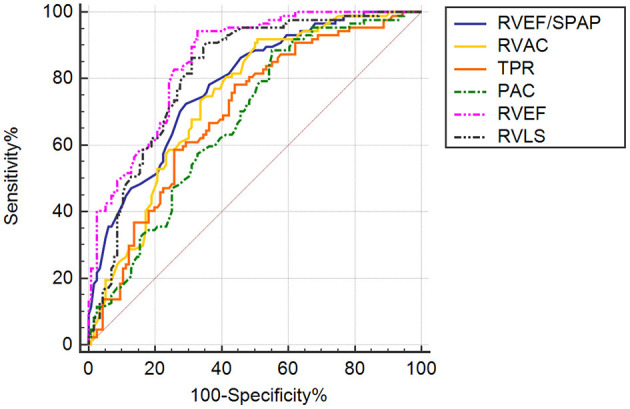
Figure 4.

ROC curve analysis of RV function indices and RV coupling to pulmonary circulation in patients with precapillary PH. AUC, area under the curve. ROC curve analysis demonstrating the abilities of RVEF/PASP, RVAC, TPR, PAC, 3D RVEF, and RVLS to predictive adverse clinical outcomes in PH patients.
