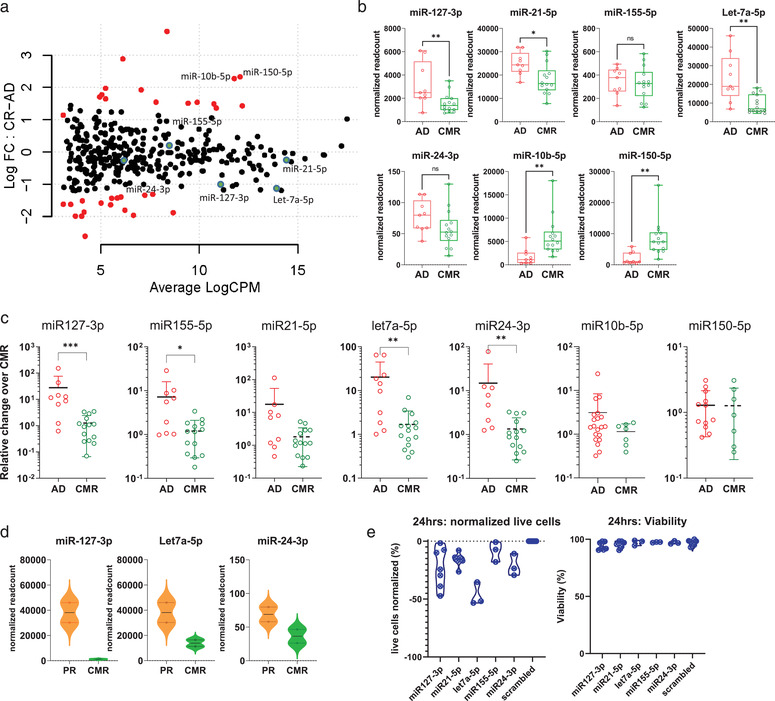
FIGURE 1.

plasma EV miRNAs as determined by small RNAseq and qRT‐PCR distinguish cHL patients with active disease from complete responders. (a) Mapplot of differential expression analysis comparing active disease samples (pre‐treatment plus partial responders) (n = 9) to complete responders (n = 10). On the y‐axis the normalized log fold change (log FC) is shown and on the x‐axis the average log count per million (CPM, i.e. normalized read counts). Each dot is a miRNA in the analysis. Red dots are significantly differently miRNAs. The green dots highlight the five candidate miRNAs. (b) Normalized read counts per EV‐miRNAs as determined by RNAseq. AD = active disease which is defined as FDG‐PET positive cHL, including partial responders (n = 9). CMR = complete metabolic response (n = 14). Every point is a single sample. Boxes show the 25%–75% percentile; whiskers show the minimum‐maximum; and lines represent the median. *P < 0.05, ** P < 0.01, *** P < 0.001, **** P < 0.0001 (Mann Whitney test). (c) qRT‐PCR of miR‐127‐3p, miR‐155‐5p, miR‐21‐5p, Let‐7a‐5p, miR‐24‐3p, miR‐10b‐5p and miR‐150‐5p cHL patients samples. For the qRT‐PCR plot of miR‐127‐3p, miR‐155‐5p, miR‐21‐5p, Let‐7a‐5p, miR‐24‐3p, active disease samples (n = 9), complete metabolic responders (n = 14) are depicted. For miR‐150‐5p: Active disease (n = 12), complete metabolic responders (n = 8). For miR10‐5p: Active disease (n = 20), complete metabolic responders (n = 7). *P < 0.05, ** P < 0.01, *** P < 0.001, **** P < 0.0001 (Mann Whitney test). Relative change is the qRT‐PCR normalized to the mean of the CMR‐group. (d) Normalized read counts from the plasma samples at time at interim‐PET. CMR = complete metabolic response and PR = partial response. (e) Cell count and viability data from KMH2 cell line electroporated with miRNA‐zippers, 24 h post electroporation. miRNA target of the zipper depicted on the x‐axis. In the first plot, the absolute live cell counts at 24 h normalized to the live cell count of the negative control are depicted on the Y‐axis in percentages. Every point is the mean of the two technical replicates of one experiment. Viability is the percentage of live cells divided by the total amount of cells present.
