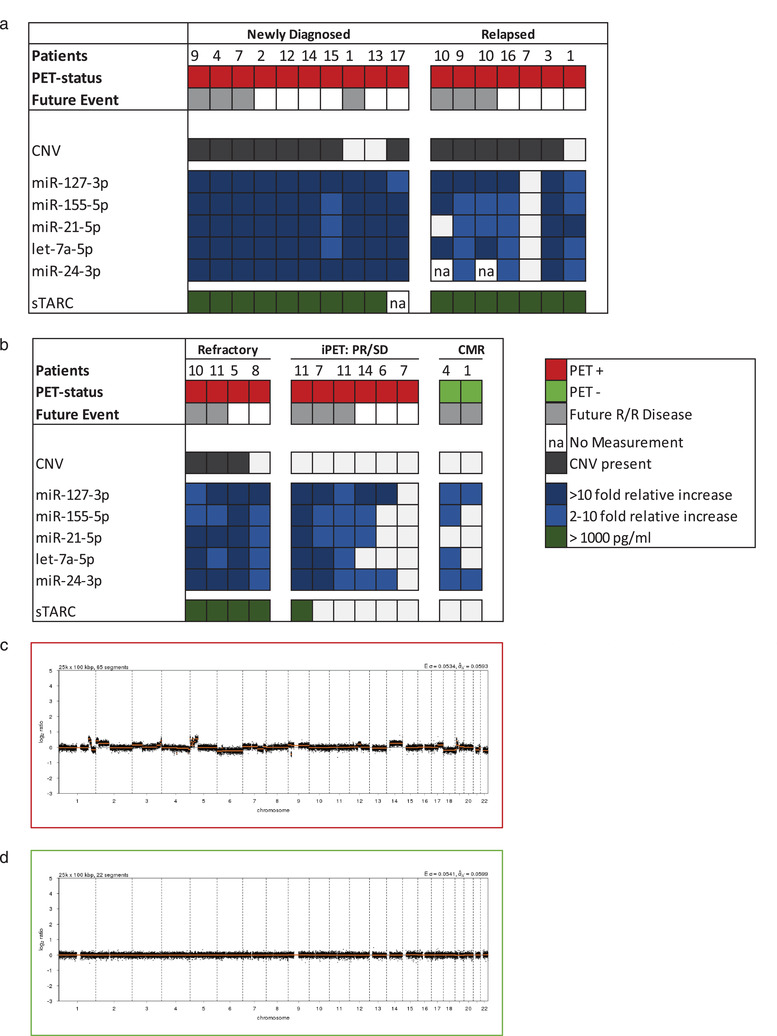
FIGURE 2.

EV‐miRNAs and sTARC outperform CNV detection in cfDNA for blood‐based cHL detection. Overview of the matched analyses of copy‐number variations (CNV), EV‐miRNAs and sTARC in 29 samples from 17 cHL patients in (a) and (b). (a) Depicts the pre‐treatment samples from newly‐diagnosed or relapsed cHL patients and (b) depict the during and post‐treatment samples. Colour legend is depicted in the figure. (c) Copy number profile of cHL patient, analysed using QDNAseq. On the x‐axis the different chromosomes are depicted, and on the y‐axis the normalized log2 ratio is shown. This is a representative example of a profile scored positive. (d) Copy number profile of cHL patient, analysed using QDNAseq. On the x‐axis the different chromosomes are depicted, and on the y‐axis the normalized log2 ratio is shown. This is a representative example of a profile scored negative. In figure (a) and (b) a negative profile is depicted as a white box.
