FIGURE 1.
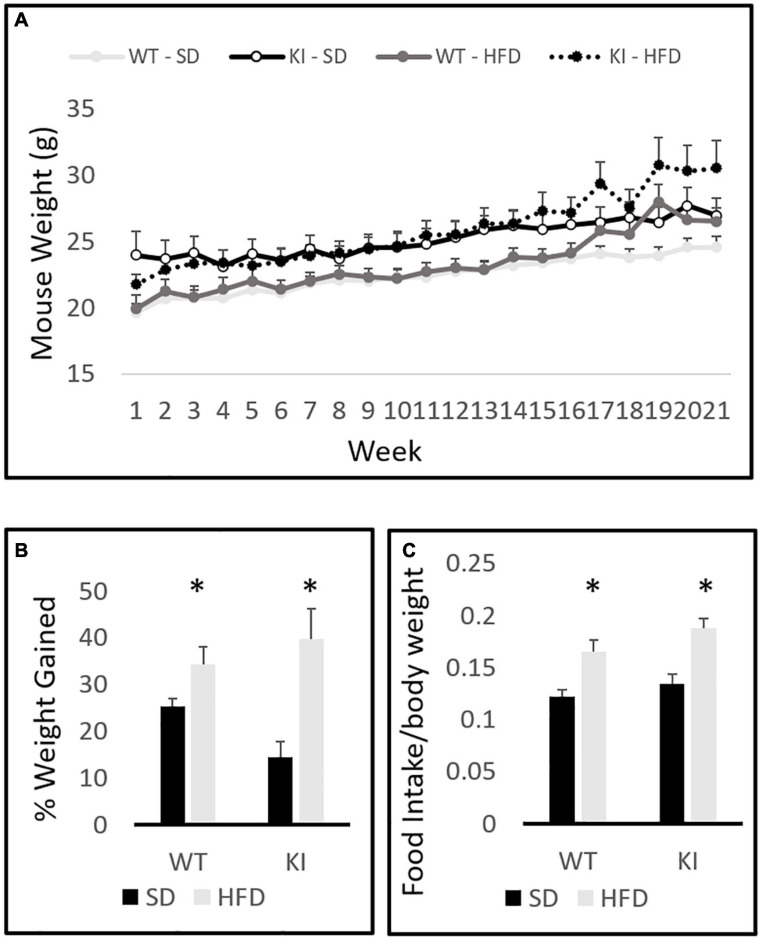
Body weights of wild-type (WT) and knock-in (KI) mice on standard diet (SD) and high fat diet (HFD). (A) Quantification of average body weights over the time course of the experiment. (B) Calculation of the average percent gain in body weight over the course of the experiment for each group. (C) Average daily food intake (grams of chow per gram body weight) in mice consuming either SD or HFD. Results are expressed as the mean, and error bars indicate standard error. “∗” indicates a significant main effect of diet by two-way ANOVA, p < 0.05. N = 10 per WT group and 11 per KI group.

