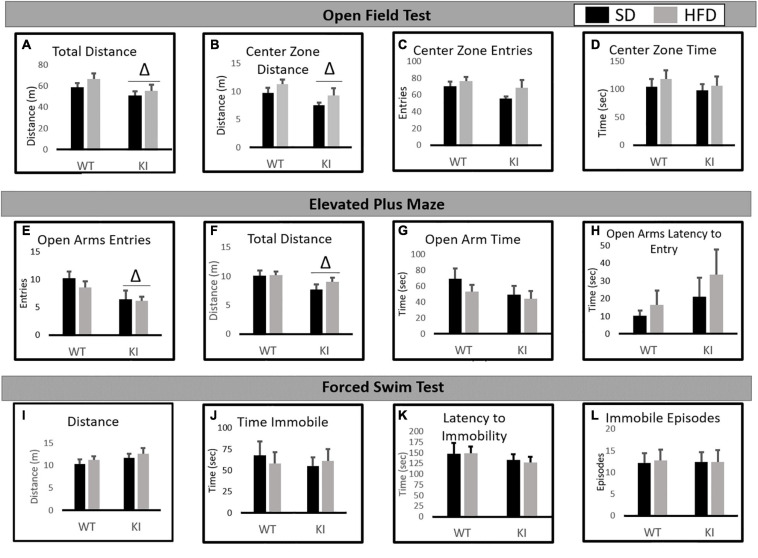
FIGURE 2.
Behavioral consequences of chronic HFD on WT and KI mice. (A) The average total distance traveled in the open field for each group. (B) The average distance traveled in the center of the open field for each group. (C) The average number of entries into the center of the open field for each group. (D) The time spent in the center of the open field in each group. (E) The average number of open arm entries. (F) Total distance traveled in the elevated plus maze (EPM). (G) The average amount of time spent in the open arms. (H) The average latency until the first entry into the open arm. (I) The total distance traveled in the FST. (J) The time spent immobile in the FST. (K) The latency until the first immobile episode in the FST. (L) The number of immobile episodes in the FST. Results are expressed as the mean, and error bars indicate standard error of the mean. “Δ” indicates a main effect of genotype by two-way ANOVA, p < 0.05. For the open field and FST, N = 10 per WT group and 11 per KI group. For the EPM, N = 9 for the WT-SD, N = 10 for the KI-SD and the WT-HFD, and N = 11 for the KI-HFD group.

