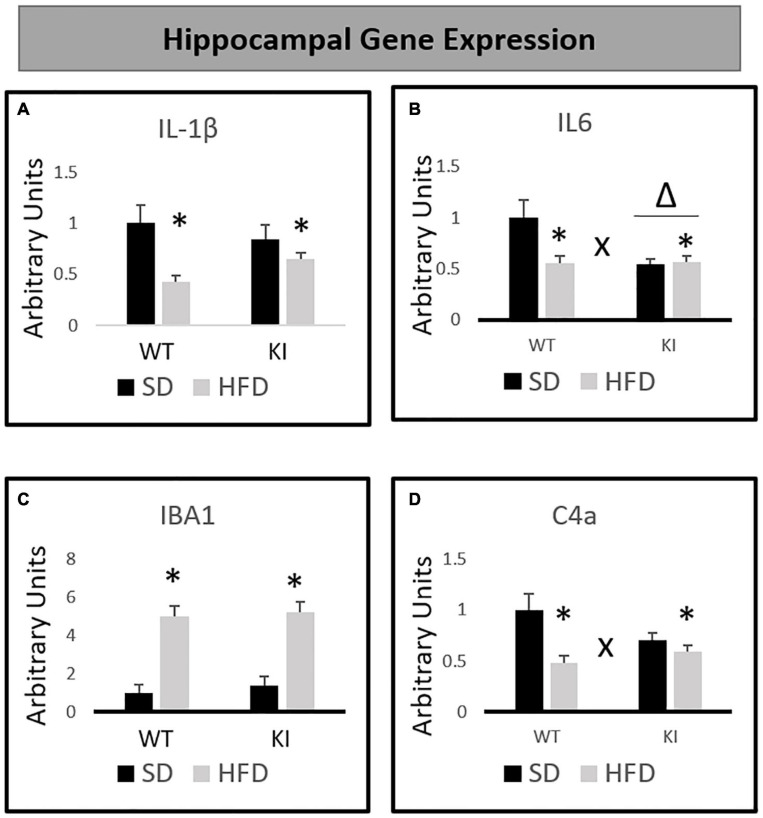
FIGURE 3.
Effects of chronic HFD on the expression of inflammation-related genes in the hippocampus of WT and KI mice. (A) Hippocampal expression of interleukin-1β (IL-1β). (B) Hippocampal expression of interleukin-6 (IL-6). (C) Hippocampal expression of ionized calcium binding adaptor molecule 1 (IBA1). (D) Hippocampal expression of complement component 4a (C4a). All data are normalized to GAPDH. Results are expressed as the mean, and error bars indicate standard error of the mean. “Δ” indicates a main effect of genotype, “∗” indicates a main effect of diet, and “X” indicates a genotype by diet interaction by two-way ANOVA. N = 9 for the WT-SD, N = 10 for the WT-HFD group, and N = 11 for both KI groups.

