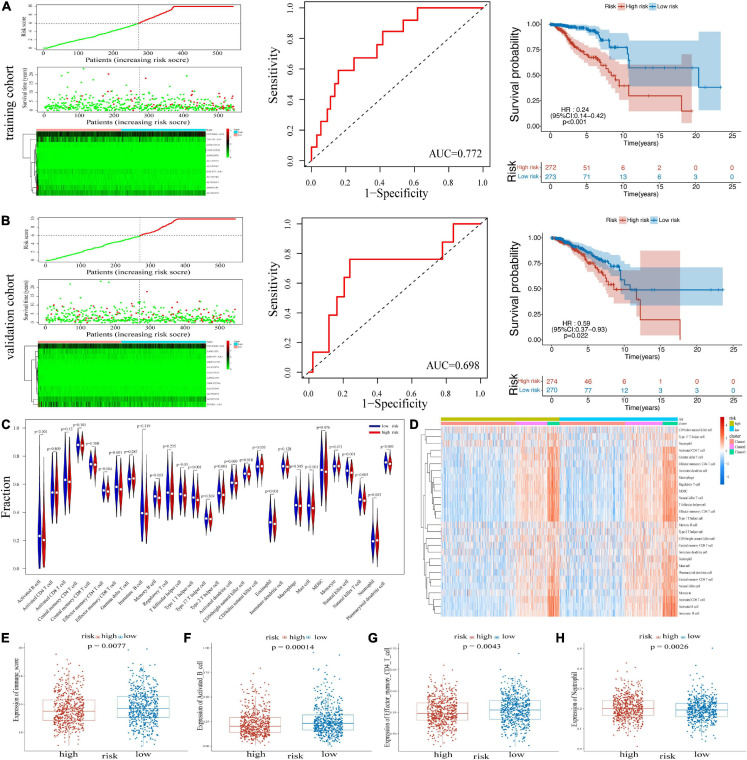
FIGURE 2.
Heatmap, distribution of risk scores, survival status, and Kaplan–Meier curves of OS for BRCA patients in TCGA training cohort (A) and validation cohort (B). (C) The infiltrating levels of 22 immune cell types in high-/low-risk subtypes. *p < 0.05 and **p < 0.01. (D) Heatmap of correlations between 22 immune cell types with risk scores and clusters. (E) Immune score in the high- and low-risk groups. (F–H) Activated B cell, effector memory CD4 T cell, and neutrophil in two risk groups. OS, overall survival; BRCA, breast cancer; TCGA, The Cancer Genome Atlas.

