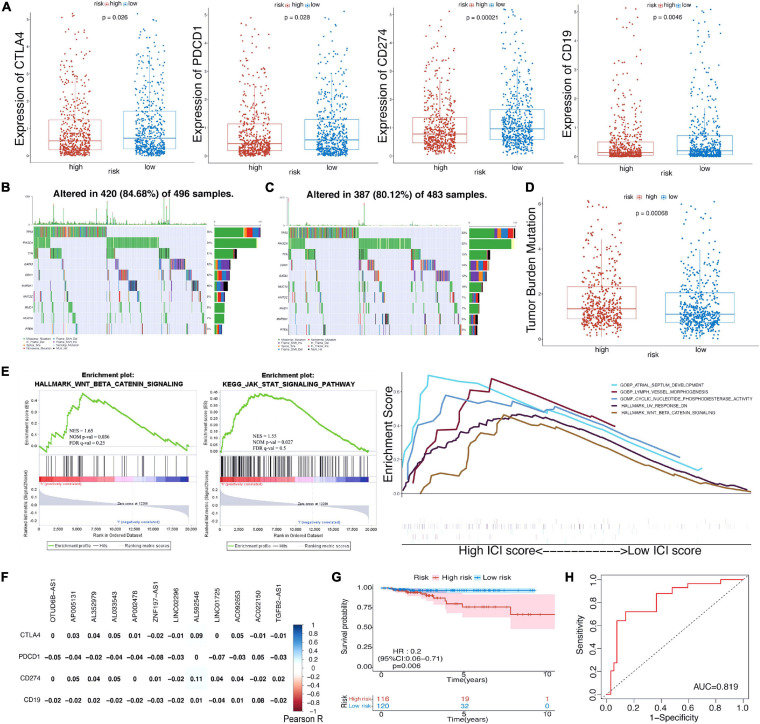
FIGURE 3.
(A) The expression level of CTLA4, PDCD1, CD274, and CD19 in high-/low-risk subtypes in TCGA cohort. (B,C) Waterfall maps of eight mutated genes in high-/low-risk subtypes. (D) The difference of tumor mutational burden between the high- and low-risk subtypes. (E) Gene set enrichment analysis (GSEA) showed the tumor hallmarks enriched in the high-risk subgroup and the relevance between biological process, molecular function, and hallmarks and m6A-LPS. (F) Heatmap of the correlations between four immune targets and the 12 prognostic m6A-related lncRNAs. (G) Kaplan–Meier curves of OS for BRCA patients in the chemotherapy subgroup. (H) ROC curve for patients with chemotherapy. TCGA, The Cancer Genome Atlas; OS, overall survival; BRCA, breast cancer; ROC, receiver operating characteristic; lncRNAs, long non-coding RNAs.

