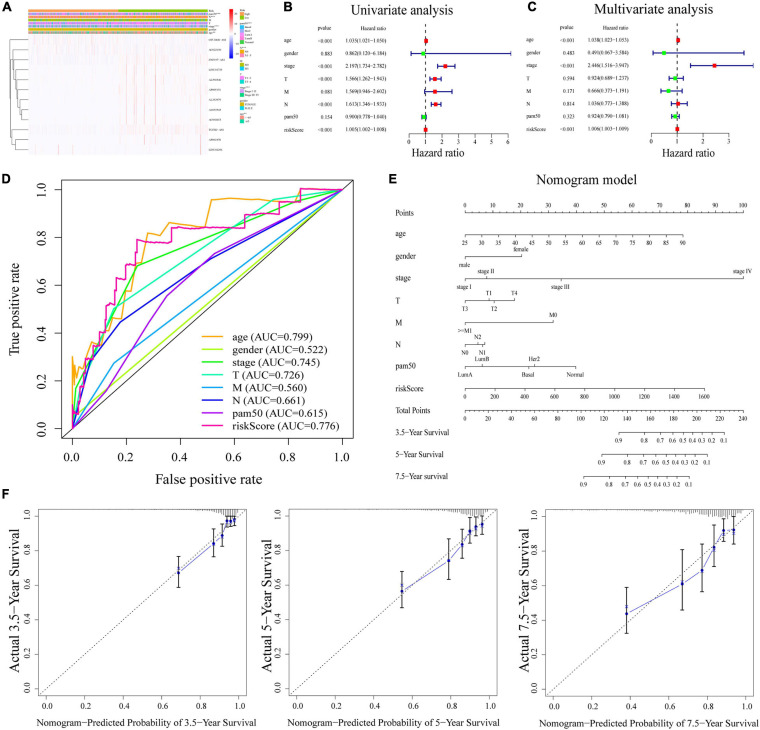
FIGURE 4.
(A) Heatmap of the association between the expression levels of the 12 m6A-related lncRNAs and clinicopathological features in The Cancer Genome Atlas (TCGA) dataset. (B,C) Risk score was an independent prognostic predictor by univariate and multivariate analyses. (D) ROC curves for the risk score, age, gender, stage, T, M, N, and PAM50. (E) Nomogram based on risk score, age, gender, stage, T, M, N, and PAM50. (F) Calibration plots of the nomogram for predicting the probability of OS at 3.5, 5, and 7.5 years. ROC, receiver operating characteristic; lncRNAs, long non-coding RNAs.

