Figure 6.
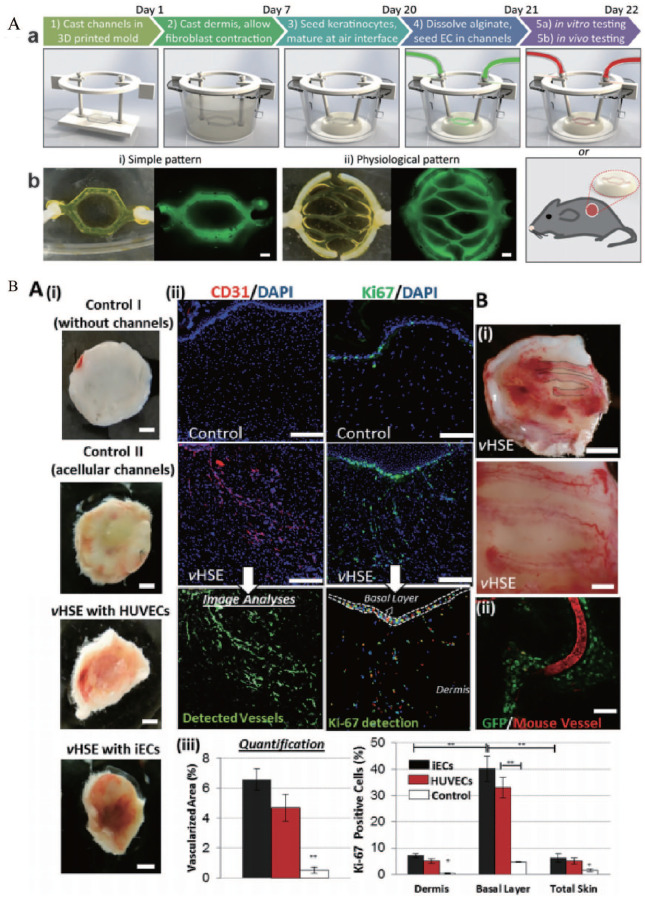
(A) Development of vascularized HSEs: (a) schematic description of the protocol to develop vHSEs, (b) two different vasculature patterns were used in our studies and generated using fluorescently tagged alginate. Scale bar: 600 μm. (B-a) The effect of vHSEs on host neovascularization. Blood perfusion in HSEs: (i) without channels (Control I), with acellular microchannels (Control II), vHSEs with HUVECs, and iECs grafted on SCID mice and harvested after 2 weeks. Scale bar: 2.5 mm, (ii) immunostaining of explanted HSEs (control) and vHSEs with CD31 (red) and Ki67 (green) to visualize the invasion of the host vessels and the presence of proliferating cells, respectively. Scale bars: 250 μm, (iii) quantification of the percentage of the total area covered by the host vasculature and the percentage of Ki-67 positive cells (*p < 0.05, **p < 0.005, and N = 4). (B-b) (i) Pictures of newly formed host vasculature following the micropatterned human iEC-containing microchannels in vHSEs Scale bars: 2.5 mm and 500 μm, (ii) confocal image of the explanted vHSEs showing the overlapping pattern of Rhodamine-dextran (70 kDa) perfused mice vessels and the microchannels containing GFP-tagged HUVECs (N = 4 for all conditions) Scale bar: 500 μm.
Source: Adapted with permission from Abaci et al. 136

