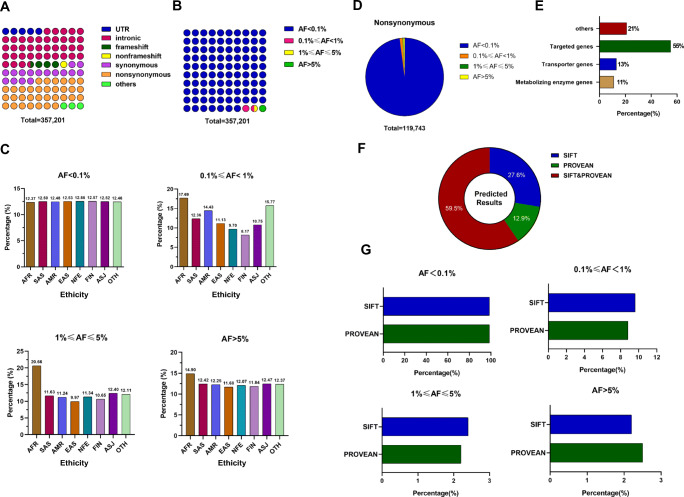
Fig. 4.
Variation profiles of pharmacogenes. (A) and (B) The distribution of all variations in pharmacogenes, which were classified according to their locations and functions (A), and MAF (B). The different colours of the circle indicate the different characteristics of variants in (A), or indicate the different MAFs in (B), while the number of circles indicates the percentage of a group of variations according to their colours as the legends indicate. (C) The proportion of variations with different MAFs in eight different ethnic groups, and the height of the column indicates the proportion in each ethnic group. (D) The distribution of nonsynonymous variations according to their MAF. The different colours of the sector indicate the different MAFs, and the proportion of the sector in the pie chart represented the percentage of a group of variations according to their colours as legends indicate. (E) The distribution of nonsynonymous variations according to the gene categories, including metabolizing enzyme genes, transporter genes, targeted genes and others. (F) The proportion of potentially damaging variations predicted by SIFT or PROVEAN software. (G) The distribution of potentially damaging variations, which were predicted by each software, according to their MAF. AFR-African, AMR-Latino, EAS-East Asian, SAS-South Asian, FIN-Finnish, NFE-non-Finnish European, ASJ-Ashkenazi Jewish, OTH-Other. UTR-untranslated regions, AF-allele frequency, SNV-single nucleotide variants, MAF-minor allele frequency

