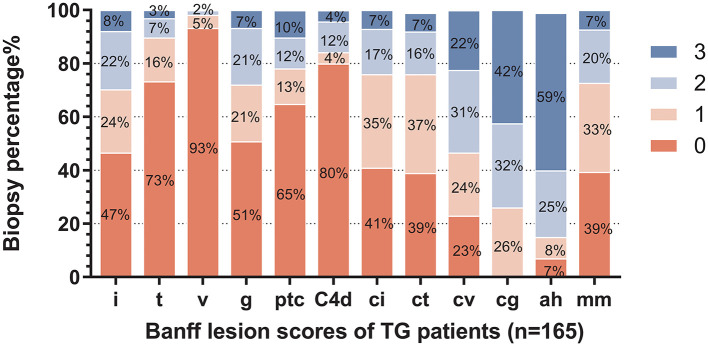
Figure 2.
Distribution of Banff lesion scores for enrolled patients. The stacked bar graph denoted the Banff lesion scores distribution and the percentages of corresponding histological changes degrees of all enrolled biopsies (n = 165) in the study were shown. The abscissa scores represent I, interstitial inflammation; t, tubulitis; v, intimal arteritis; g, glomerulitis; ptc, peritubular capillaritis; C4d, endothelial cells C4d staining extent of peritubular capillary and medullary vasa recta; ci, interstitial fibrosis; ct, tubular atrophy; cv, vascular fibrous intimal thickening; cg, glomerular basement membrane double contours; ah, arteriolar hyalinosis; and mm, mesangial matrix expansion.

