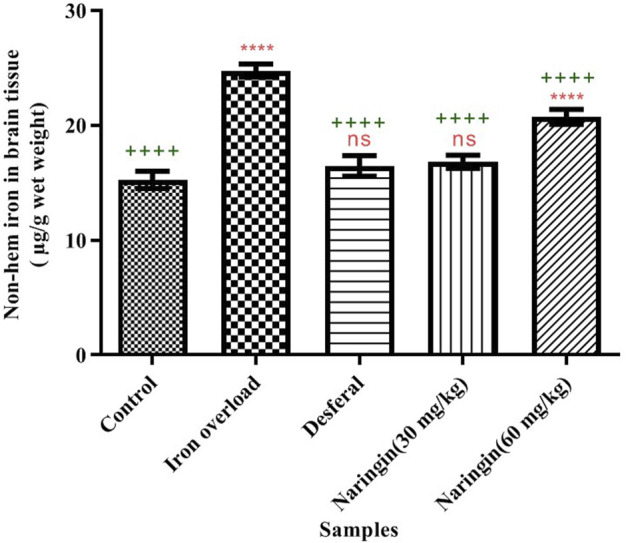
FIGURE 2.

Total nonheme iron content in the brain of different groups. Control group: the mice were treated by normal saline; iron-overloaded group: the mice that were treated by iron dextran; DFO group: iron-overloaded mice that were treated by deferoxamine; naringin 30 mg/kg/day group: iron-overloaded mice that were treated by naringin 30 mg/kg/day; and naringin 60 mg/kg/day group: iron-overloaded mice that were treated by naringin 60 mg/kg/day (means ± SD). “++++” and “ns” indicate probability levels of 0.0001 and nonsignificant, respectively. The stars indicate the probability levels in the same way. “*” shows the comparison of the mean of all groups with the control group. “+” shows the comparison of the mean of all groups with the iron-overloaded group.
