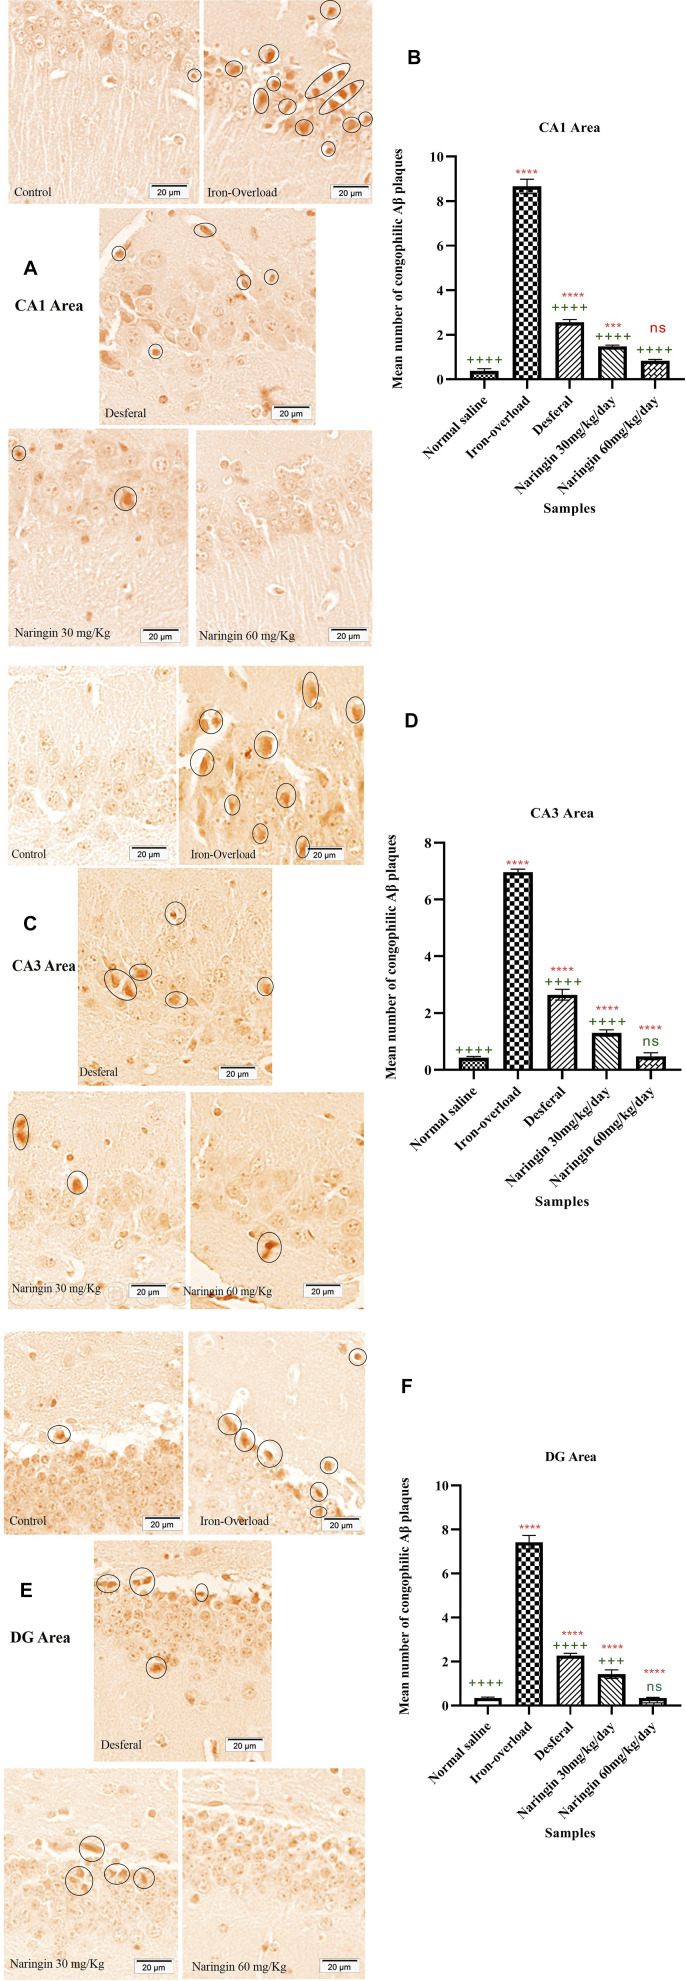
FIGURE 4.
(A) and (B) CR staining for amyloid-β plaque and the number of amyloid plaques in the hippocampal CA1 area of the mice hippocampus, (C) and (D) CR staining for amyloid-β plaque and the number of amyloid plaques in the hippocampal CA3 area of the mice hippocampus, and (E) and (F) CR staining for amyloid-β plaque and the number of amyloid plaques in the hippocampal DG area of the mice hippocampus. Control group: the mice that were treated by normal saline; iron-overload group: the mice that were treated by iron dextran; DFO group: iron-overloaded mice that were treated by DFO; naringin 30 mg/kg/day group: iron-overloaded mice that were treated by naringin 30 mg/kg/day; naringin 60 mg/kg/day group: iron-overloaded mice that were treated by naringin 60 mg/kg/day. Scale bar shows 20 μm. Aβ plaques are red in color, and they are shown by a black circle. “++++,” “+++,” and “ns” indicate probability levels of 0.0001, 0.001, and nonsignificant, respectively. The stars indicate the probability levels in the same way. “*” shows the comparison of the mean of all groups with the control group. “+” shows the comparison of the mean of all groups with the iron-overloaded group.

