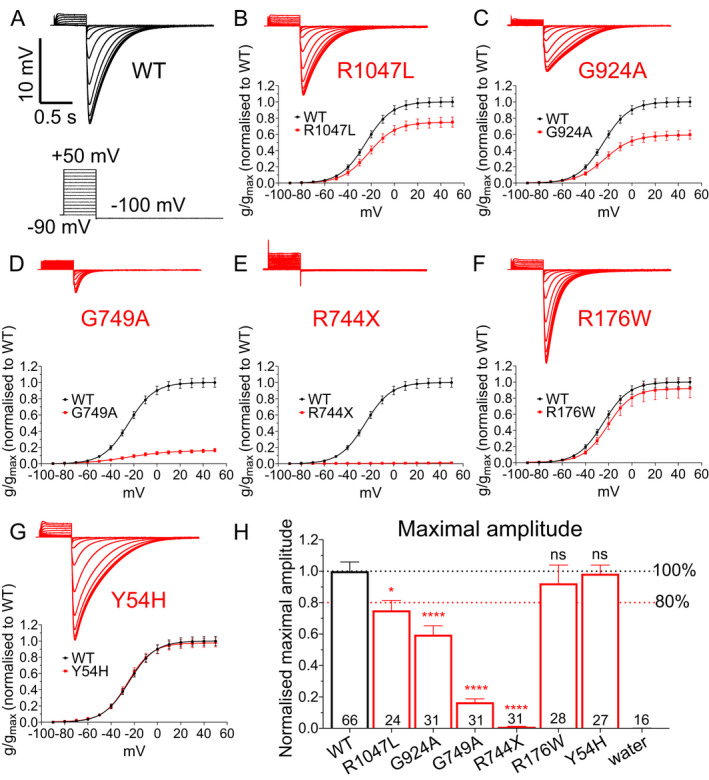
FIGURE 1.

Functional analysis of KCNH2 variants from SUDEP patients. (A) Sample recording traces of Kv11.1 wild‐type (WT) channels. Insert: cartoon of the voltage protocol applied. (B–G) Sample recording traces of Kv11.1 variant channels (top) and average normalized conductance–voltage relationships (below) comparing Kv11.1 WT and variant channels for (B) R1047L, (C) G924A, (D) G749A, (E) R744X, (F) R176W, and (G) Y54H variants. (H) Average maximal amplitude for each variant. Number in each bar represents the number of independent oocytes recorded for each variant. Black and red dashed lines indicate 100% and 80%, respectively, of maximal current amplitude of Kv11.1WT channel. *p < 0.05, ****p < 0.0001.
